Oil – Brent Future Prices

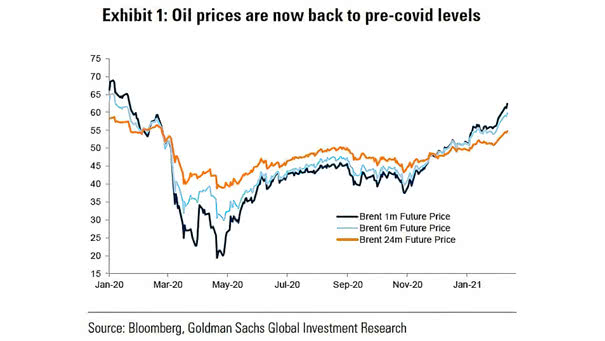
Oil – Brent Future Prices Oil prices are back to pre-covid levels. Will pro-cyclical stocks outperform, driven by strong global economic growth in 2021 and 2022? Image: Goldman Sachs Global Investment Research

Rotation vs. U.S. GDP Growth Forecasts

Rotation vs. U.S. GDP Growth Forecasts Chart suggesting that the rotation out of bonds into equities, out of growth into cyclicals, out of large caps into small caps, and out of gold into copper, is expected to continue in 2020. Image: Fidelity Investments

U.S. Equity Market Outperformance

U.S. Equity Market Outperformance According to Gavekal, U.S. outperformance is mainly cyclical, not structural, and best investment opportunities could be in non-US assets. Image: Gavekal, Macrobond

S&P 500 and Seasonal Rotation Strategy

S&P 500 and Seasonal Rotation Strategy Sell in May and go away? This chart suggests that a rotation between defensive and cyclical sectors was a much better strategy Image: CFRA, S&P Global

MSCI World Index Valuation at Cycle Peaks and Troughs

MSCI World Index Valuation at Cycle Peaks and Troughs On average, the MSCI World Index currently trades at a price-to-earnings ratio that has marked cyclical peaks in the stock market over the past 50 years. Image: Charles Schwab

Citi Economic Surprise Index and S&P 500

Citi Economic Surprise Index and S&P 500 The Citi Economic Surprise Index has risen sharply, but it has an inconsistent history in terms of its correlation with the S&P 500. It is a cyclical indicator: high readings suggest favouring defensives over cyclicals, and low readings suggest favouring cyclicals over defensives. Image: Renaissance Macro

U.S. Business Cycle Indicator

U.S. Business Cycle Indicator The Morgan Stanley’s cyclical indicator is still in “downturn.” The entry into the “downturn” phase suggests lower returns for stocks and risky assets. Image: Morgan Stanley Research

Equity Market Driven by Bonds Not Profits

Equity Market Driven by Bonds Not Profits The chart shows a widening gap between cyclicals and bond proxies. It is clearly a cyclical bear market within a bull market, as during the dotcom bubble. Image: Societe Generale Cross Asset Research

Lower Returns for Stocks in the Next 12 Months?

Lower Returns for Stocks in the Next 12 Months? Morgan Stanley’s cyclical indicator is flagging “downturn.” The yield curve’s slope, debt issuance, consumer confidence, economic and financial markets data are aggregated in Morgan Stanley’s cyclical indicator. The entry into the “downturn” phase suggests lower returns for stocks and risky assets in the next 12 months. Image:…