U.S. Stock Market Bull and Bear Indicator – S&P 500
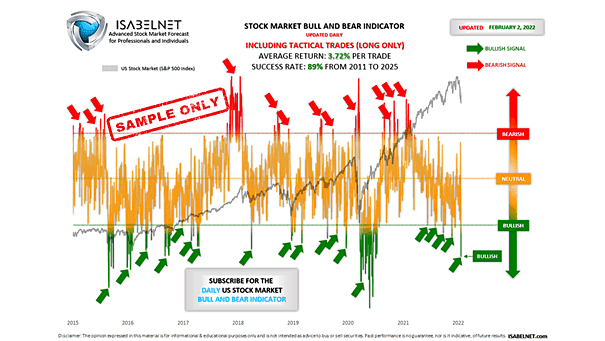
U.S. Stock Market Bull and Bear Indicator – S&P 500 Three Fridays ago, our Stock Market Bull & Bear Indicator was bullish well before the opening bell and the S&P 500 followed through, closing up…
U.S. Stock Market Bull and Bear Indicator – S&P 500 Three Fridays ago, our Stock Market Bull & Bear Indicator was bullish well before the opening bell and the S&P 500 followed through, closing up…
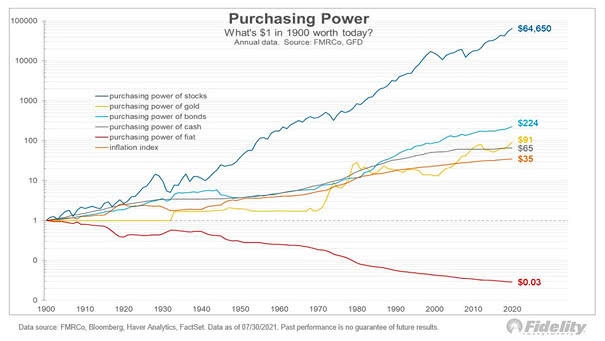
Purchasing Power of the U.S. Dollar (Measured by Inflation): Invested vs. Uninvested Gold hasn’t lost its glow, but U.S. stocks have shone brighter since 1928. Look far enough ahead, and the edge moves to assets…
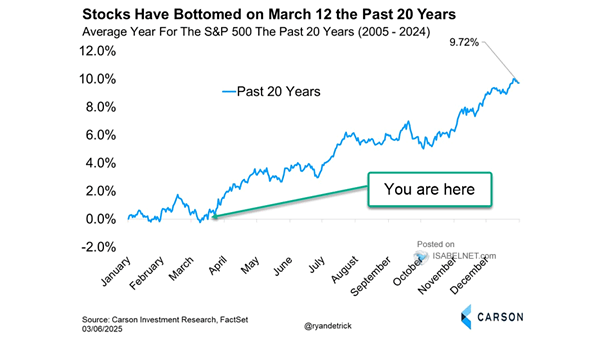
Average Year for the S&P 500 the Past 20 Years Over the past two decades, March 12 has often marked the bottom for U.S. stocks, with rebounds taking shape soon after. History doesn’t always repeat itself,…
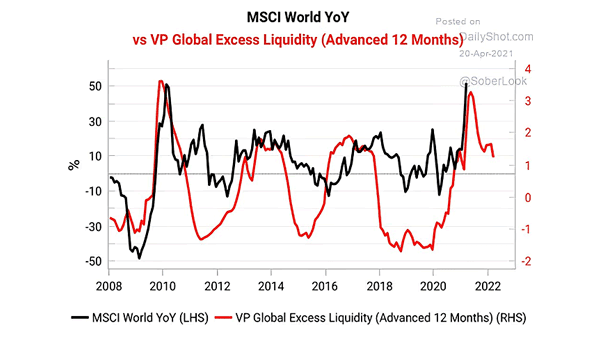
S&P 500 – MSCI U.S. vs. G10 Excess Liquidity (Leading Indicator) G10 excess liquidity, the gap between real money growth and economic growth, is climbing again as it returns to post‑pandemic highs and gives U.S.…
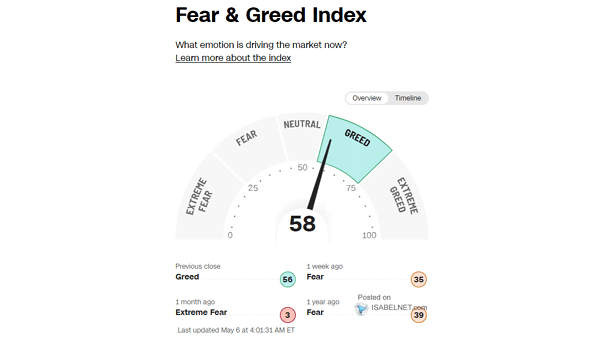
Fear & Greed Index – Investor Sentiment With the Fear & Greed Index down at 19, markets have slipped back into extreme fear. Traders are on edge, some already slamming the panic button, a setup contrarian…
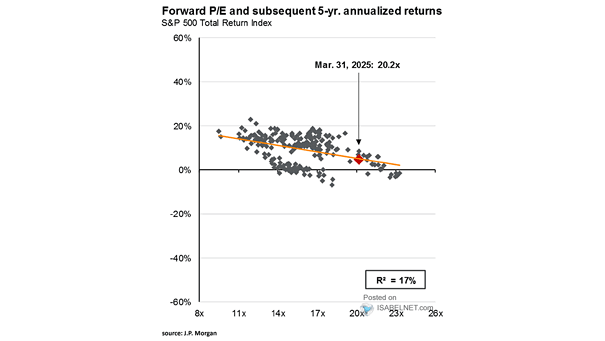
Forward P/E Ratio and Subsequent 5-Year Annualized Returns Elevated U.S. stock valuations point to a tougher road for returns over the coming five years. That’s the classic problem: great companies, but not always great prices.…
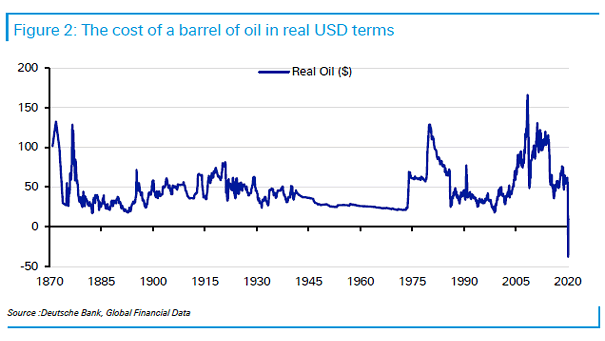
WTI Oil Prices in Real Terms The longer the oil shock lasts, the more it threatens to reshape the broader economy. For now, traders are betting on a short-lived spike, expecting that tensions will ease…
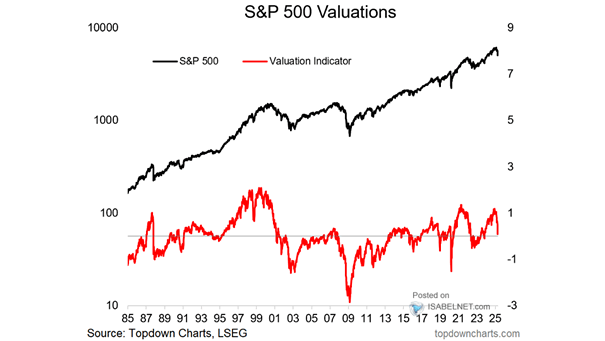
S&P 500 Sentiment and Valuations Cracks are emerging as S&P 500 sentiment and valuation indicators are slipping from stretched territory, a move investors should keep an eye on. Markets rarely stay overheated for long. Image:…
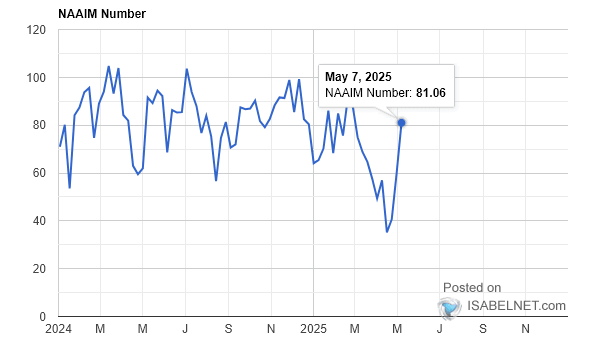
NAAIM Exposure Index – Investor Sentiment With the index at 66.99, active managers are stepping back from U.S. equities, a retreat from recent peaks as a wave of caution moves through the market. The National Association…
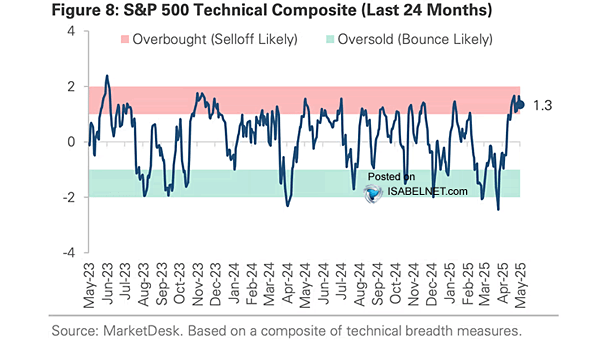
S&P 500 Technical Composite A composite of technical breadth measures puts the S&P 500 in oversold territory, raising the odds of a short-term bounce. Oversold conditions like this often lead to quick reversals. Image: MarketDesk…
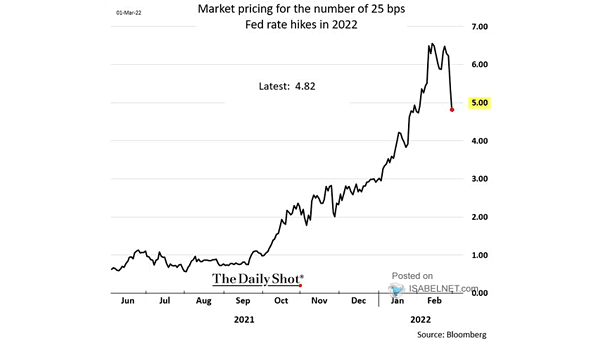
Interest Rates – Market Pricing for the Number of Fed Rate Cuts Will the Fed cut rates by just 25 basis points in 2026? That wouldn’t surprise anyone. Markets might wish for more, but for…