S&P 500 Around Close Presidential Elections

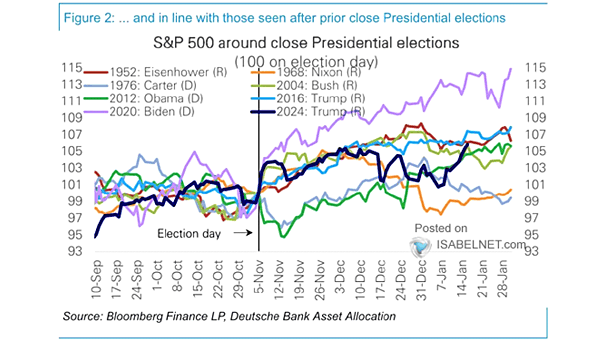
S&P 500 Around Close Presidential Elections The cyclical behavior of equity markets around U.S. elections reflects a pattern where pre-election pullbacks are common, followed by post-election rallies as policy uncertainties dissipate. Image: Deutsche Bank Asset Allocation
S&P 500 Performance in Election Years

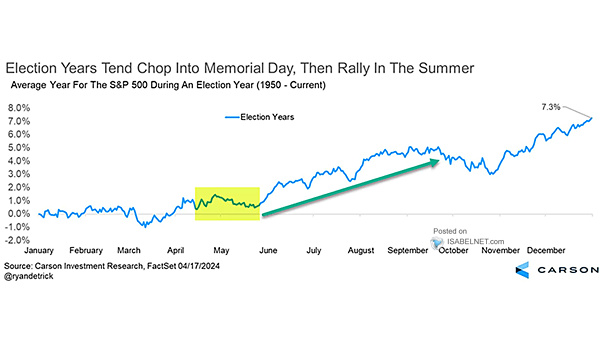
S&P 500 Performance in Election Years In U.S. election years, September and October often see weak market performance. However, November and December typically strengthen as election uncertainty resolves, boosting investor confidence and market stability. Image: Carson Investment Research

Post-Election Day S&P 500 Returns

Post-Election Day S&P 500 Returns While investors have responded positively to the election results, the true effects of new policies remain uncertain. The market’s robust performance is based on expectations, not realized economic outcomes. Image: Bloomberg

S&P 500 Returns After the Election

S&P 500 Returns After the Election The U.S. stock market has shown a notable tendency to perform well following presidential elections. In fact, after the last ten elections, stocks have increased in value nine times, with a median gain of 17.2% one year later. Image: Carson Investment Research

S&P 500 Around U.S. Election Date

S&P 500 Around U.S. Election Date Following the 2020 presidential election, the U.S. stock market exhibited robust growth. Can investors expect a similar trend after the 2024 election? Image: Deutsche Bank

S&P 500 Around Predictable U.S. Presidential Elections

S&P 500 Around Predictable U.S. Presidential Elections While U.S. elections can create anxiety and volatility due to policy uncertainties, predictable elections often coincide with continued market trends and reduced market volatility. Image: Deutsche Bank Asset Allocation

S&P 500 Around Close Presidential U.S. Elections

S&P 500 Around Close Presidential U.S. Elections Election Day frequently serves as a catalyst for the S&P 500, with the index typically surging as political uncertainties give way to clarity. Image: Deutsche Bank

Average Year for the S&P 500 during an Election Year

Average Year for the S&P 500 during an Election Year This election year appears to be among the strongest for the S&P 500 so far. Historically, the S&P 500 tends to experience a period of weakness leading up to the U.S. elections, followed by a potential rally towards year-end. Image: Carson Investment Research

S&P 500 and Odds of Winning U.S. Presidential Election

S&P 500 and Odds of Winning U.S. Presidential Election The rising odds for Trump in prediction markets have been closely tied to an upswing in S&P 500 prices, reflecting investor sentiment that aligns with potential changes in economic policy should he win the election. Image: Morgan Stanley Research

S&P 500 YTD Returns as of the End of September in Election Years

S&P 500 YTD Returns as of the End of September in Election Years The S&P 500 has demonstrated a remarkable performance in 2024, marking the best first nine months of an election year since 1950, driven by strong corporate earnings, resilient consumer spending, and investor optimism. Image: Carson Investment Research

S&P 500 Performance After >20% Pre-Election Years

S&P 500 Performance After >20% Pre-Election Years Following a pre-election year gain exceeding 20%, the S&P 500 index has consistently shown positive growth during the election year, with an average increase in value of 11.3% since 1950. Image: Carson Investment Research