S&P 500 Bull Markets

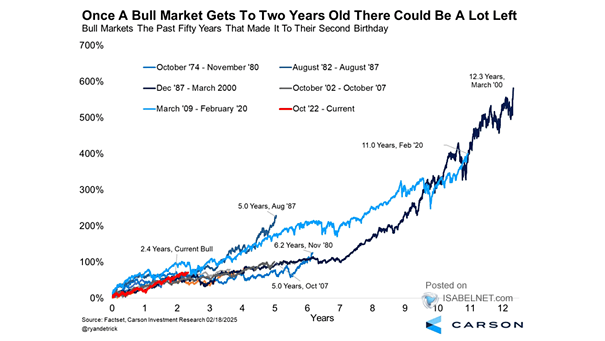
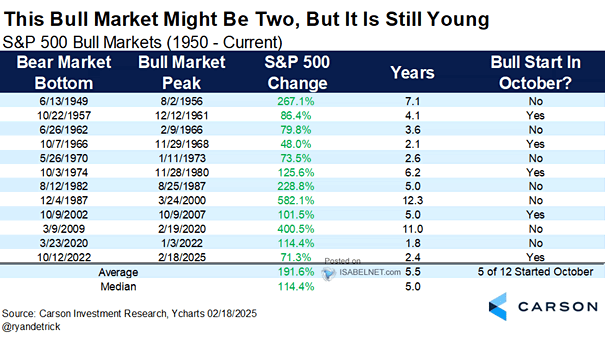
S&P 500 Bull Markets Over the past 50 years, five bull markets lasted over two years, averaging 8 years and a 288% gain, suggesting that the current two-year-old bull market may still have potential for further growth. Image: Carson Investment Research
S&P 500 Bull Markets

S&P 500 Bull Markets The S&P 500’s bull market recently marked its second anniversary, indicating potential for continued growth. Historical data shows that bull markets lasting beyond two years often suggest more years of upward momentum ahead. Image: Carson Investment Research

First, Middle, Final Years of S&P 500 Bull Markets since 1975

First, Middle, Final Years of S&P 500 Bull Markets since 1975 The chart shows that the S&P 500 has generated a 26.9% return on average, in the final years of bull markets since 1975, excluding the current bull market. You may also like “Equity Market Performance Around Bear Markets.” Image: Legg Mason

S&P 500 Average Returns in Bull Markets

S&P 500 Average Returns in Bull Markets While the third year of a bull market often shows weakness, patient investors may find opportunities in years 4-6, as historical patterns suggest potential for continued growth. Image: Carson Investment Research

Percentage Change in S&P 500 in Previous Bull Markets

Percentage Change in S&P 500 in Previous Bull Markets The current bull market appears to be in its early stages, with historical data supporting the potential for significant gains in the coming months and years. Image: Bloomberg

Secular Bull Market – S&P 500 Weekly Chart with the 40-Week MA and 200-Week MA

Secular Bull Market – S&P 500 Weekly Chart with the 40-Week MA and 200-Week MA The S&P 500 has reached the 5600s target based on the bullish cup and handle pattern that formed in 2022-2023. The early-2024 breakout to new all-time highs projects further upside potential to the 6150 level. Image: BofA Global Research

S&P 500 – Seasonality During Bull vs. Bear Markets

S&P 500 – Seasonality During Bull vs. Bear Markets The sell-in-May effect may be more relevant in bear markets. In bull markets, it may be seen as a missed opportunity for potential gains, given the positive momentum and upward trends typically observed in the market. Image: Topdown Charts

Secular Bull Market Analogs and S&P 500

Secular Bull Market Analogs and S&P 500 Since the Great Recession, U.S. stocks have behaved like a secular bull market, which is characterized by an extended period of growth and rising prices. Image: BofA Global Research

S&P 500 – Secular Bull and Bear Markets

S&P 500 – Secular Bull and Bear Markets The strong performance of the S&P 500 in 2023 and 2024 could be seen as a clear indication of a more sustained secular bull market, potentially extending until the late 2020s and early 2030s. Image: BofA Global Research Click the Image to Enlarge