Copper to Gold Ratio and U.S. 10-Year Treasury Yield

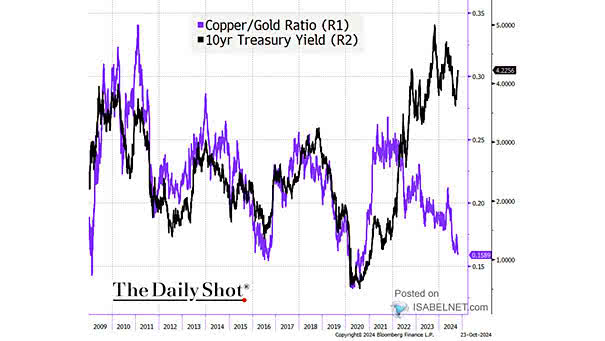
Copper to Gold Ratio and U.S. 10-Year Treasury Yield The copper-to-gold ratio is often considered a leading indicator for the direction of the 10-year U.S. Treasury yield under certain market conditions. Image: The Daily Shot
China 10-Year Yield and Copper to Gold Ratio

China 10-Year Yield and Copper to Gold Ratio Chart showing the weekly correlation between China 10-year yield and the copper to gold ratio (R² = 0.58). Image: Bloomberg

Copper to Gold Ratio

Copper to Gold Ratio The copper to gold ratio provides useful information on the evolution of the U.S. 10-year Treasury, the ISM Non-Manufacturing Index and the average weekly hours worked. Image: Paolo Cardena

Copper to Gold Ratio and U.S. 10-Year Treasury Yield

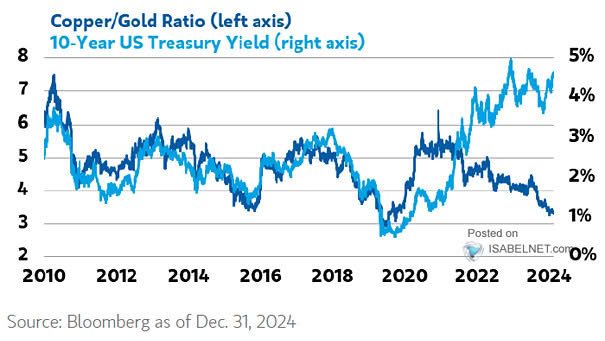
Copper to Gold Ratio and U.S. 10-Year Treasury Yield The chart suggests that the correlation between the copper/gold ratio and the US 10-year Treasury yield is still valid. Image: Nordea and Macrobond

U.S. 10-Year Yields vs. Copper to Gold Ratio

U.S. 10-Year Yields vs. Copper To Gold Ratio Great chart showing a strong correlation between U.S. 10-year yields and the copper to gold ratio. Image: Nordea and Macrobond

Gold-to-Copper Price Ratio

Gold-to-Copper Price Ratio The gold-to-copper price ratio is currently far from a level of complacency. Image: J.P. Morgan