Cycle Composite for the S&P 500

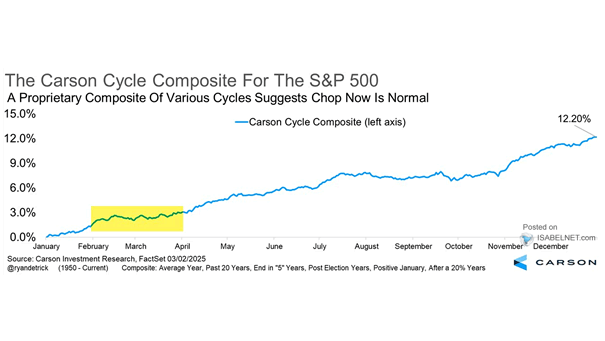
Cycle Composite for the S&P 500 Based on historical market behavior, the Carson Cycle Composite offers valuable insights into market trends and suggests a forthcoming period of strength for the S&P 500. Image: Carson Investment Research
S&P 500 Monthly Returns and Percentage of Time Up – Presidential Cycle Year 4

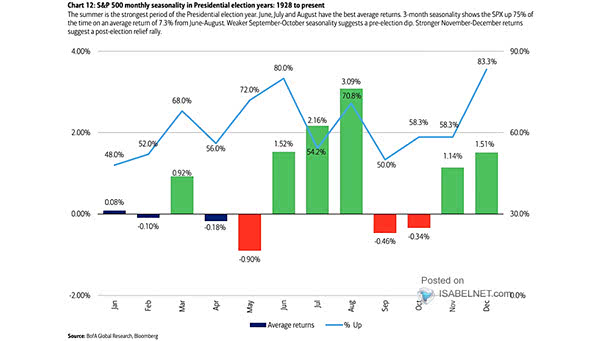
S&P 500 Monthly Returns and Percentage of Time Up – Presidential Cycle Year 4 Seasonality provides valuable insights into stock market trends. Historically, after experiencing weaknesses in September and October during election years, the S&P 500 tends to rebound with strong returns in November and December. Image: BofA Global Research

Performance of Gold and Fed Cutting Cycles

Performance of Gold and Fed Cutting Cycles Federal Reserve interest rate cuts are often perceived as favorable for gold prices, particularly during periods of economic downturn. Image: Goldman Sachs Global Investment Research

EPS Growth – Political Party and S&P 500 Profits Cycle

EPS Growth – Political Party and S&P 500 Profits Cycle While election results can impact markets in the short term, the underlying profitability of companies is a stronger driver of stock prices over time. Image: BofA US Equity & US Quant Strategy

S&P 500 3-Month Seasonal Returns and Presidential Cycle Year 4

S&P 500 3-Month Seasonal Returns and Presidential Cycle Year 4 June to August historically shines during election years, as it represents the strongest 3-month period in the fourth year of the presidential cycle, up 75% of the time with an average return of 7.27% since 1928. Image: BofA Global Research

S&P 500 Performance (May – October) Broken Down by Presidential Cycle

S&P 500 Performance (May – October) Broken Down by Presidential Cycle Sell in May and go away? Since 1950, the S&P 500 has shown an average return of 2.3% during the period from May through October in election years, making it an attractive period for investors. Image: Carson Investment Research

S&P 500 Returns – The 4-Year Presidential Cycle

S&P 500 Returns – The 4-Year Presidential Cycle The current presidential cycle for the S&P 500 is extended when compared to both the average and first term cycles, highlighting the market’s unique dynamics and complexity. Image: BofA Global Research

S&P 500 Presidential Cycle

S&P 500 Presidential Cycle Considering the substantial cyclical correction in 2022, the current presidential cycle suggests that there is potential for the S&P 500 to perform well in 2024. Image: BofA Global Research

S&P 500 with Start of Rate Cut Cycles and U.S. Recessions

S&P 500 with Start of Rate Cut Cycles and U.S. Recessions Historically, the S&P 500 has tended to post positive returns in the 12 months following the Fed’s first rate cut, unless the U.S. economy enters recession. Image: Deutsche Bank

U.S. Recession and Fed Hiking Cycle

U.S. Recession and Fed Hiking Cycle Based on the lags between rate hikes and previous cycles, the likelihood of a recession in the United States remains a topic of discussion. Image: Deutsche Bank