S&P 500 and 10-Month Moving Average

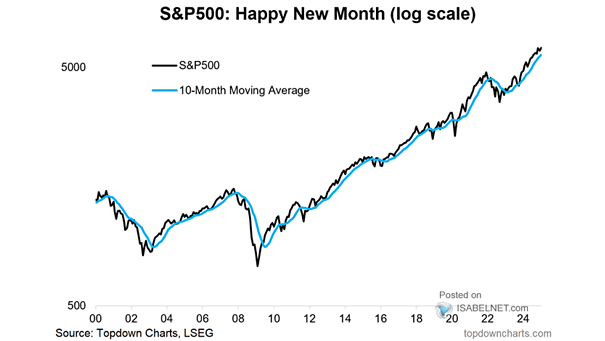
S&P 500 and 10-Month Moving Average With a 21% year-to-date gain including dividends, the S&P 500 demonstrates the vitality of the cyclical bull market that started in late 2022. Conditions remain favorable for continued growth. Image: Topdown Charts
S&P 500 and Days Without a Correction to 200-Day Moving Average

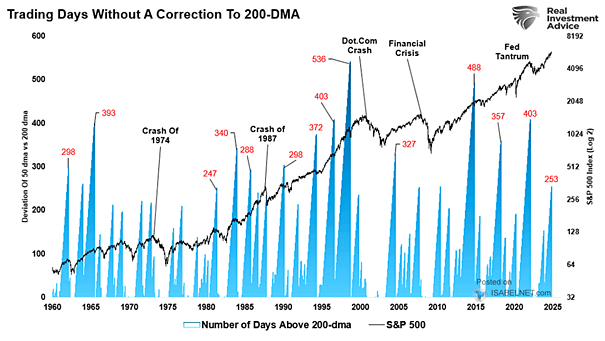
S&P 500 and Days Without a Correction to 200-Day Moving Average The S&P 500 is experiencing an impressive streak of 253 trading days without a correction to its 200-day moving average, indicating strong bullish momentum that could potentially continue in the near term. Image: Real Investment Advice

Gold and 200-Day Moving Average

Gold and 200-Day Moving Average With gold trading at levels not seen in 40 years, there is potential for price stabilization or correction in the coming months, as historical trends show that gold often remains flat for 1 to 6 months after such extremes. Image: BofA Global Research

Average Gold Returns After Trading Certain Distances from 200-Day Moving Average

Average Gold Returns After Trading Certain Distances from 200-Day Moving Average Gold is currently 15% above the 200-day moving average, suggesting short-term bullish sentiment. However, historical trends indicate that investors should brace for potentially flat returns in the following 1 to 6 months after such extremes. Image: BofA Global Research

Percentage of S&P 500 Stocks Above 200-Day Moving Average

Percentage of S&P 500 Stocks Above 200-Day Moving Average The percentage of S&P 500 stocks above their 200-day moving average is showing signs of a bearish divergence, which can be an early warning signal of a potential market correction. Image: BofA Global Research

Dow Jones Industrial Average Weekly Chart with Moving Averages

Dow Jones Industrial Average Weekly Chart with Moving Averages The technical analysis suggests that the Dow Jones may potentially surpass the 42,600 mark in the near term, with the possibility of further gains towards the 45,200 level. Image: BofA Global Research

S&P 500 Index and Moving Average Crossover Signal

S&P 500 Index and Moving Average Crossover Signal The use of moving average crossovers, particularly on a weekly basis, can be a valuable tool for investors in managing risk to equity exposure. Image: Real Investment Advice

High-Yield Bonds vs. 200-Day Moving Average

High-Yield Bonds vs. 200-Day Moving Average In search of higher returns, investors have been pursuing riskier investments through high yield bonds. While this strategy can be rewarding, it also exposes them to increased vulnerability if market conditions worsen. Image: BofA Global Investment Strategy