U.S. Economic Policy Uncertainty Index

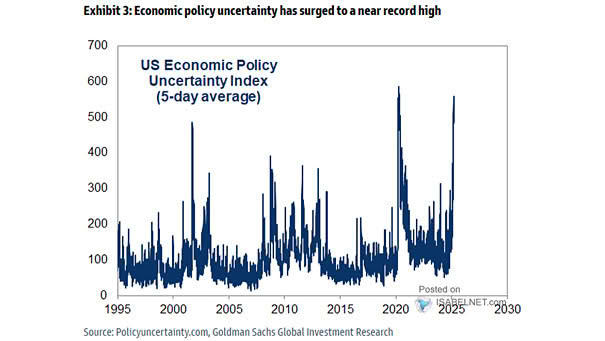
U.S. Economic Policy Uncertainty Index High policy uncertainty can lead to recessions. Currently, U.S. economic policy uncertainty is higher than during the financial crisis. Image: Deutsche Bank Asset Allocation
U.S. Equity Volatility and Global Economic Policy Uncertainty

U.S. Equity Volatility and Global Economic Policy Uncertainty The chart shows that U.S. equity volatility does not mirror global economic policy uncertainty since 2009, perhaps due to strong central bank support. Image: Pictet Wealth Management

Bloomberg Dollar Spot Index

Bloomberg Dollar Spot Index The combination of Federal Reserve policy uncertainty and inflation expectations under the Trump administration is contributing to the recent strength of the U.S. dollar. Image: Bloomberg

S&P 500 Sector Expectations

S&P 500 Sector Expectations Chart suggesting quarantines end in June and economic growth recovers to means, based on consumer searches, economic data and policy uncertainty. Image: Arbor Research & Trading LLC

Passive Over Active Funds

Passive Over Active Funds History suggests that investor outflows from active funds are smallest after periods of high policy uncertainty. Image: Goldman Sachs Global Investment Research

Societe Generale’s Chart of Swan Risks

Societe Generale’s Chart of Swan Risks This chart shows the downside and upside risks to the growth outlook. Biggest risks (black swan): protectionism/trade wars (25%), and European policy uncertainty (20%) Image: Societe Generale Cross Asset Research

U.S. Equity Sentiment Conditions Index

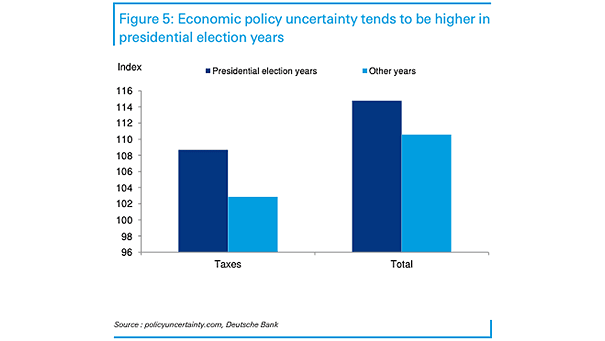
U.S. Equity Sentiment Conditions Index U.S. equity sentiment appears to be at relatively depressed levels heading into the 2024 U.S. presidential election, due to heightened uncertainty, market volatility, and concerns about potential policy shifts. Image: Pictet Asset Management