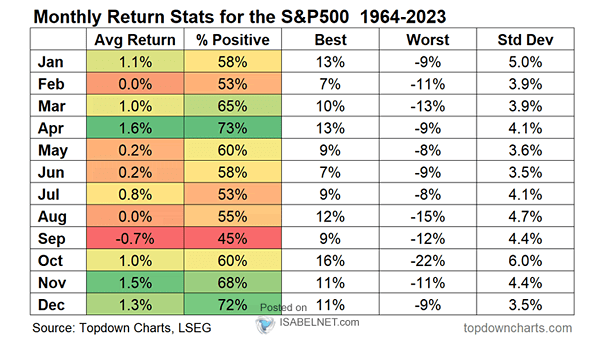
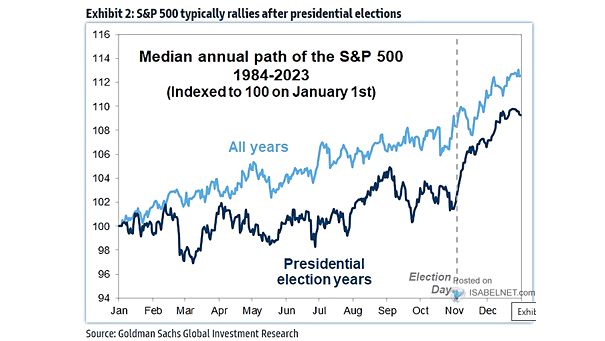
VIX Seasonality
VIX Seasonality As the 2024 U.S. presidential election approaches, market volatility is expected to remain elevated but should decline after the election results are known. Image: Topdown Charts
Seasonality – S&P 500 Index Average Monthly Returns While October usually delivers positive returns for the S&P 500, election years often temper this trend due to increased uncertainty and market volatility. Image: Carson Investment Research
Seasonality – Monthly Return Stats for the S&P 500 While October generally brings positive performance for the S&P 500, this trend is often dampened during election years due to heightened uncertainty and market volatility. Image: Topdown Charts
S&P 500 Seasonality Election Day often marks a turning point for the S&P 500, with the index typically rallying as policy uncertainties are resolved. Image: Goldman Sachs Global Investment Research
Seasonality – Average Daily Performance of the S&P 500 Although the S&P 500 benefits from robust earnings growth and positive expectations for monetary policy, U.S. stocks often experience weakness in September and October. Image: Deutsche Bank
S&P 500 3-Month Seasonality Returns Since 1928, August to October has been the weakest 3-month period of the year, with the S&P 500 rising 54.2% of the time and an average return of -0.14%. Image: BofA Global Research
Seasonality of Market Performance – MSCI USA August and September have historically been less favorable months for U.S. equities, with lower average performance compared to other months. Image: BofA Global Quantitative Strategy
Seasonality – Average Annualized S&P 500 Price Return by Month BofA’s strategists are cautioning investors about the potential for significant market corrections in the near term, driven by weak seasonal patterns and the uncertainties surrounding the U.S. election. Image: BofA US Equity & Quant Strategy
S&P 500 Seasonality Since 1928 The seasonal trends observed since 1928 indicate a pattern where July and August typically see positive stock performance, followed by a dip in late summer and a rally into the year-end. Image: BofA Global Research
Seasonality Trends in MSCI AC World Index (Global Equities) July has historically been a strong month for global equities, offering opportunities for investors to capture potential gains. Image: BofA Global Quantitative Strategy