U.S. Heavy Truck Sales and Recessions

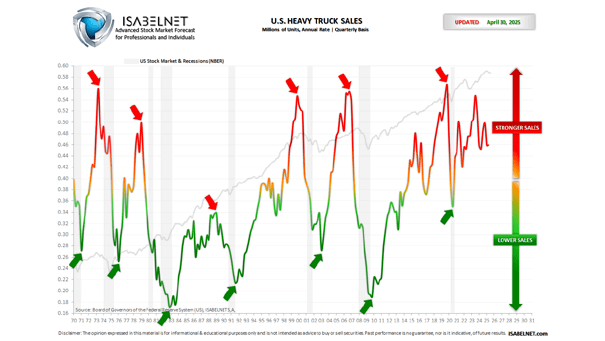
U.S. Heavy Truck Sales and Recessions U.S. heavy truck sales rose in November to 491K (annualized). Before recessions, heavy trucks sales tend to peak and then decline, providing insights into the overall health of the U.S. economy as a leading economic indicator. Click the Image to Enlarge
Truck Tonnage vs. S&P 500 Index

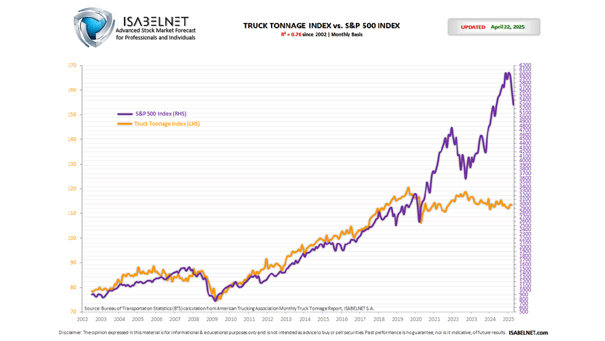
Truck Tonnage vs. S&P 500 Index The Truck Tonnage Index decreased 1.9% in November. Trucks represent 72.6% of U.S. freight and serve as a barometer of the U.S. economy. This chart shows that the U.S. stock market tends to increase in line with the physical size and expansion of the U.S. economy (R² = 0.78…

ATA Truck Tonnage Index

ATA Truck Tonnage Index The drop in truck tonnage indicates a decrease in demand. Image: Morgan Stanley Wealth Management

Truck Tonnage vs. Air and Rail Freight

Truck Tonnage vs. Air and Rail Freight Trucks represent 70% of U.S. freight and serve as a barometer of the U.S. economy. This chart suggests that shipping has changed since the Great Financial Crisis, but is not deteriorating. Image: Arbor Research & Trading LLC

Heavy Truck Sales as Recession Indicator

Heavy Truck Sales as Recession Indicator Historically, before recessions, heavy truck sales tend to peak (red arrow) and then decline (black arrow). Currently, heavy truck sales have a nice upward slope and show no sign of peaking. So, it suggests that there is no imminent recession on the horizon. You may also like “U.S. Heavy…

Oil Demand by Sector

Oil Demand by Sector It may take a while for oil demand to rebound, as cars and trucks account for 40% of oil demand. Image: Deutsche Bank Global Research