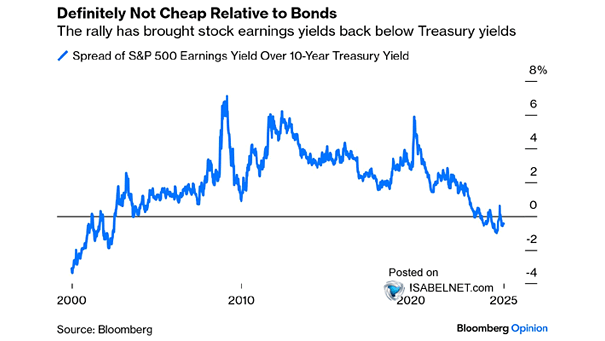
S&P 500 Earnings Yield Plus 10-Year U.S. Treasury Yield Minus CPI

Valuation – S&P 500 Earnings Yield Plus 10-Year U.S. Treasury Yield Minus CPI The current low yield environment for both U.S. stocks and bonds relative to inflation presents a challenging landscape for investors, prompting many to explore alternative investment strategies to achieve desired returns. Image: Bloomberg
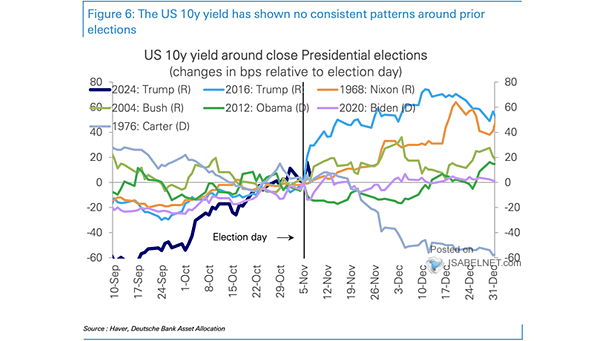
U.S. 10-Year Treasury Yield Around Close Presidential Elections

U.S. 10-Year Treasury Yield Around Close Presidential Elections While U.S. elections are significant in shaping economic policy and affecting investor sentiment, they do not consistently drive changes in the U.S. 10-year Treasury yield. Image: Deutsche Bank Asset Allocation

U.S. Real Yields

U.S. Real Yields While not extreme, the current U.S. real interest rate of about 2% is relatively high, reflecting a restrictive monetary policy aimed at bringing inflation under control. Image: Bloomberg

U.S. 10-Year Treasury Yields Forecast

U.S. 10-Year Treasury Yields Forecast Goldman Sachs forecasts the 10-year U.S. Treasury yield to hit 3.85% by end-2024, diverging from current futures market expectations. Image: Goldman Sachs Global Investment Research

30-Year U.S. Treasury Yields Around Presidential Election Dates

30-Year U.S. Treasury Yields Around Presidential Election Dates Historically, 30-year U.S. Treasury yields have tended to rise after Republican victories and fall after Democratic victories, reflecting market perceptions of each party’s economic policies. Image: Deutsche Bank

U.S. Bond Yields

U.S. Bond Yields The era of ultra-low interest rates that followed the 2008 financial crisis should be seen as a historical anomaly. It is unlikely that U.S. bond yields will return to their post-crisis lows. Image: Gavekal, Macrobond

Average 1-Month S&P 500 Return vs. Change in 10-Year U.S. Treasury Yields

Average 1-Month S&P 500 Return vs. Change in 10-Year U.S. Treasury Yields The S&P 500 typically struggles when U.S. Treasury yields rise quickly. This is largely due to decreased stock valuation multiples, especially for high-priced mega-cap growth companies that thrive in low-rate environments. Image: Goldman Sachs Global Investment Research

Copper to Gold Ratio and U.S. 10-Year Treasury Yield

Copper to Gold Ratio and U.S. 10-Year Treasury Yield The copper-to-gold ratio is often considered a leading indicator for the direction of the 10-year U.S. Treasury yield under certain market conditions. Image: The Daily Shot

U.S. 10Y-2Y Yield Curve

U.S. 10Y-2Y Yield Curve The recent un-inversion of the 2s10s Treasury yield curve may indicate a positive outlook for U.S. stocks, especially if economic stability and growth persist. Image: J.P. Morgan

S&P 500 and U.S. High Yield OAS

S&P 500 and U.S. High Yield OAS The new cycle low in the U.S. high yield option-adjusted spread is seen as a promising signal for the S&P 500, supporting bullish expectations as we approach the end of the year. Image: BofA Global Research