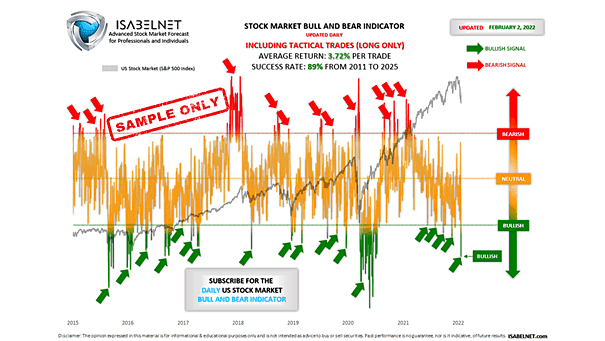
S&P 500 Index and Technical Score

S&P 500 Index and Technical Score The S&P 500, with its current reading of 26.99, remains in technically oversold territory, suggesting the potential for a short-term rally. Image: Real Investment Advice

U.S. Equity Index P/E Valuations vs. History

U.S. Equity Index P/E Valuations vs. History Compared to historical standards, both tech and S&P 500 valuations remain elevated, raising questions about future market performance. Image: Goldman Sachs Global Investment Research

Consolidated Equity Positioning

Consolidated Equity Positioning Consolidated equity positioning currently stands at the 29th percentile, suggesting a notable level of risk aversion among investors in the current market environment. Image: Deutsche Bank Asset Allocation

Different Market Sentiment Indicators

Different Market Sentiment Indicators Trump’s economic policies, particularly his tariff plans, have caused significant shifts in investor sentiment, driving market volatility and creating an environment of uncertainty. Image: Goldman Sachs Global Investment Research

Magnificent 7 vs. S&P 493 Relative Return

Magnificent 7 vs. S&P 493 Relative Return The Magnificent 7’s dominance in terms of innovation, profitability, and market positioning could sustain their outperformance longer than expected. Image: Goldman Sachs Global Investment Research

ISABELNET Cartoon of the Day

ISABELNET Cartoon of the Day As the S&P 500 tumbled into a 10% correction, bears are grinning, eager to deport bulls from Wall Street, but bulls remain optimistic, waiting for their visas to be extended!…

CTAs Allocation in Oil

CTAs Allocation in Oil Commodity Trading Advisors have significantly reduced their exposure to oil in the current market climate. Image: Deutsche Bank Asset Allocation

Median 2-Week S&P 500 Returns

Median 2-Week S&P 500 Returns Bulls have reason for optimism, as the S&P 500 has historically exhibited positive performance trends during the final two weeks of March since 1950. Image: Goldman Sachs Global Investment Research

Valuation – MSCI World 12-Month Forward P/E

Valuation – MSCI World 12-Month Forward PE The current global stock market valuation, with a 12-month forward P/E ratio of 17.2, is relatively high compared to its 20-year median. Image: Goldman Sachs Global Investment Research

Risk Parity Model Portfolio Weights

Risk Parity Model Portfolio Weights In risk-parity strategies, the equity allocation currently sits below the median at the 36th percentile, reflecting concerns about market conditions and a preference for safer assets. Image: Deutsche Bank Asset…