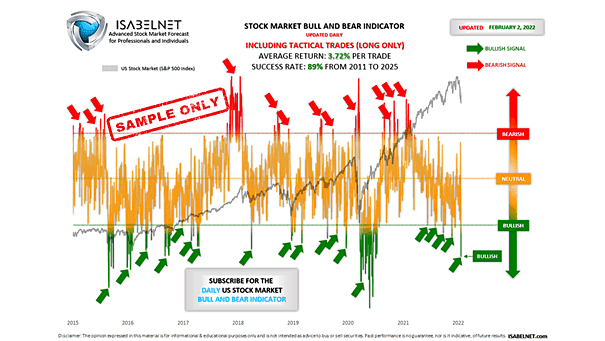
U.S. Stock Market Bull and Bear Indicator – S&P 500
U.S. Stock Market Bull and Bear Indicator – S&P 500 On Monday last week, our Stock Market Bull & Bear Indicator was bullish well before the opening bell and the S&P 500 followed through, closing…
U.S. Stock Market Bull and Bear Indicator – S&P 500 On Monday last week, our Stock Market Bull & Bear Indicator was bullish well before the opening bell and the S&P 500 followed through, closing…
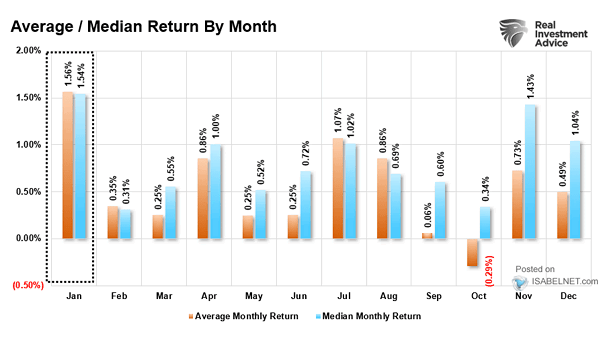
S&P 500 Annual vs. Intra-Year Returns The S&P 500 typically posts a 5% to 10% pullback at least once a year. With March already delivering a double-digit decline, the next dip may be more contained.…
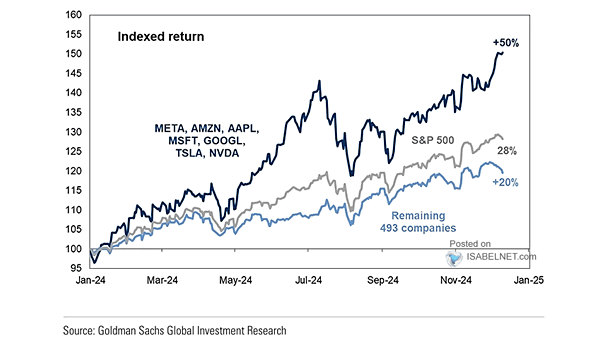
Indexed Returns of AI-Related Portfolios vs. Equal-Weight S&P 500 Infrastructure has driven the AI rally, with chip giants, data center builders and cloud platforms capturing the upside while software and productivity names fall behind. Image:…
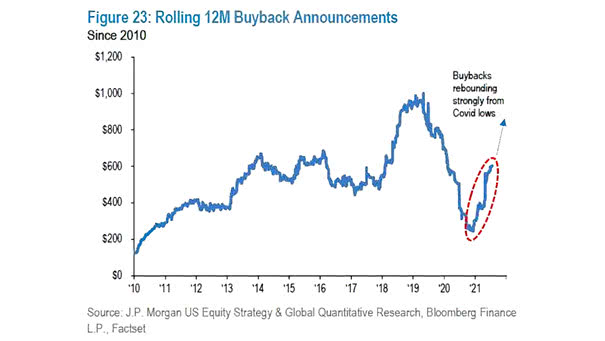
Global Share Buyback Announcements Global share buybacks show no signs of slowing, as steady earnings keep the pipeline full. For shareholders, that’s a supportive backdrop, and unless profits falter, the momentum looks durable. Image: J.P.…
Capex as % of Cash Flow from Operations All signs point to hyperscalers reinvesting nearly all operating cash flow into capex, a tailwind for infrastructure suppliers but a potential headwind for equity returns if free…
U.S. Tech Media Telecom Valuations vs. ROE Investors are still willing to pay a premium for U.S. tech, media, and telecom stocks, and with robust returns on equity, those valuations look broadly justified. Image: Goldman…
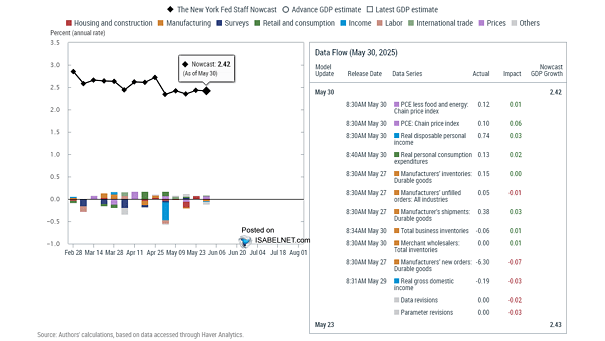
New York Fed GDP Nowcast The New York Fed lifted its Q3 2026 U.S. GDP nowcast to 2.47% from 2.36% last week, still signaling a steady expansion. Image: Federal Reserve Bank of New York Click…
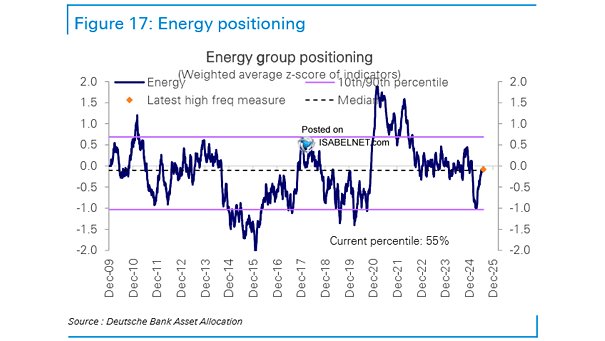
Energy Group Positioning Energy sits in the 91st percentile on positioning, firmly in overweight territory. With strong earnings momentum largely priced in, the sector looks exposed if oil prices soften. Image: Deutsche Bank Asset Allocation
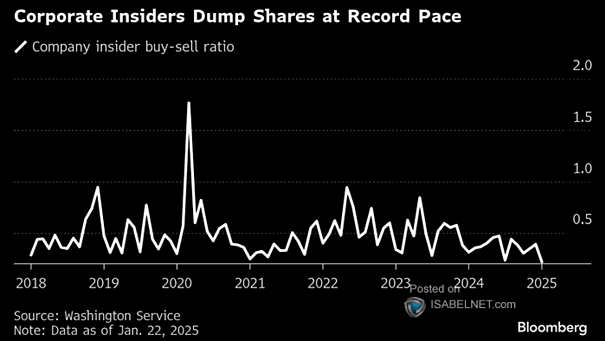
S&P 500 Index vs. Insider Sells Insider selling usually rises with the market, as higher prices prompt executives to lock in gains. Lately, though, selling has cooled even as equities climb, pointing to a reduced…
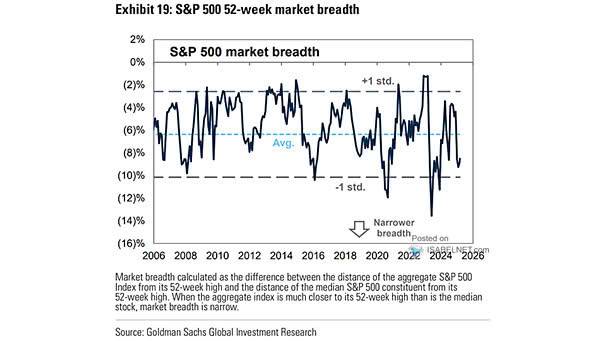
Market Breadth – Percent Below 52-Week High S&P 500 Index Less Median Stock Gains appear solid on the surface, but beneath it the foundation is thinner, with S&P 500 highs masking narrow breadth, still shy…
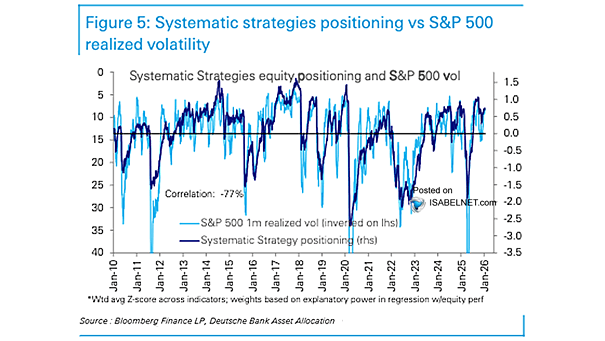
Systematic Strategies Equity Positioning vs. S&P 500 Realized Volatility When markets are tranquil, systematic strategies tend to stay aggressively long equities to capture steady upside, a positioning that can unwind sharply when volatility comes back.…