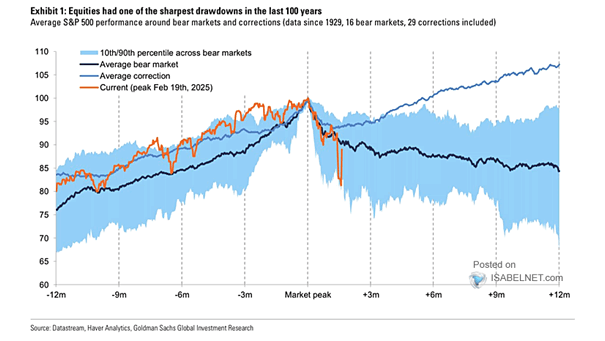
S&P 500 Drawdowns

S&P 500 Drawdowns Since 1950 A dovish monetary policy pivot has historically supported more positive U.S. equity returns. Image: Goldman Sachs Global Investment Research

U.S. Stock Market Valuations – Combined P/E Ratio

U.S. Stock Market Valuations – Combined P/E Ratio High P/E ratios in U.S. tech stocks are a double-edged sword: they reflect both the sector’s growth potential and the risks of overvaluation driven by investor optimism.…

ISABELNET Cartoon of the Day

ISABELNET Cartoon of the Day The S&P 500 index rose 5.7% this week, giving bulls a reason to celebrate—market gains never looked so good! Have a Great Weekend, Everyone! 😎

AAII U.S. Investor Sentiment Bearish Readings > 50

AAII U.S. Investor Sentiment Bearish Readings > 50 The current AAII U.S. Investor Sentiment Bearish reading of 58.9% marks the 7th consecutive week above 50%, aligning with the record streak observed in October 1990, which…

Global Market Implied Equity Risk Premiums

Global Market Implied Equity Risk Premiums The current low U.S. equity risk premium highlights a difficult investment climate, with investors potentially undercompensated for the risks of equity investing. Image: Goldman Sachs Global Investment Research

S&P 500 Price Targets

S&P 500 Price Targets The recent historic rally in U.S. stocks, driven by President Trump’s 90-day tariff reprieve, masks underlying challenges that suggest the 2025 market highs may already be in the rearview mirror. Image:…

S&P 500 5% Gains and What Happened Next

S&P 500 5% Gains and What Happened Next Since 1950, the S&P 500 has surged 5% or more in a single day on 23 occasions. A year later, stocks climbed an average of 26.9%, with…

Valuation – PE10 Ratio: USA vs. Rest of the World

Valuation – PE10 Ratio USA vs. Rest of the World Investors seeking diversification and long-term growth may prefer emerging markets and non-U.S. developed markets over U.S. stocks due to their attractive valuations. Image: Topdown Charts

MSCI AC World Calendar Year Returns vs. Intra-Year Declines

MSCI AC World Calendar Year Returns vs. Intra-Year Declines Despite median intra-year drops of 15%, the global equity index ended positively in 34 of the past 45 years—highlighting the value of long-term investing over reacting…