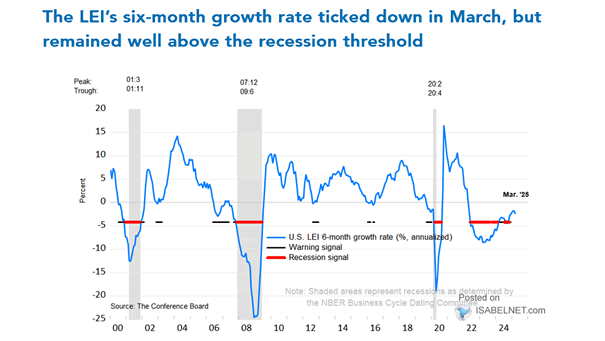
S&P 500 Annual Highs Per Month

S&P 500 Annual Highs Per Month While the S&P 500 has fallen into a 10% correction since its peak in February, it’s premature to conclude that this represents the peak for the year 2025. Historically,…

U.S. Equity Flows

U.S. Equity Flows The S&P 500’s correction has not only affected market performance but also altered individual investors’ behavior, with many refraining from “buying the dip” due to increased caution amid economic and market uncertainties.…

ISABELNET Cartoon of the Day

ISABELNET Cartoon of the Day As the Fed leaves rates unchanged and tariff concerns persist, bulls are navigating markets like a plane battling turbulent skies—holding firm and hoping for a break in the storm! Have…

Tariffs Impact on YoY U.S. GDP Growth

Tariffs Impact on YoY U.S. GDP Growth Goldman Sachs forecasts that tariffs will reduce U.S. GDP growth by approximately 0.8 percentage points over the next year, with tax cuts and regulatory easing only offsetting 0.1…

Truck Tonnage vs. S&P 500 Index

Truck Tonnage vs. S&P 500 Index The Truck Tonnage Index increased 3% in February. Trucks represent 72.7% of U.S. freight and serve as a barometer of the U.S. economy. This chart shows that the U.S.…

S&P 500 Quarterly EPS

S&P 500 Quarterly EPS Consensus earnings estimates have been reduced more than usual for first quarters, primarily due to the direct impacts of a stronger dollar and tariffs, rather than a broad economic slowdown. Image:…

ISABELNET Cartoon of the Day

ISABELNET Cartoon of the Day Wall Street bears think every bull market is just smoke and mirrors. And when the crash finally hits, they love to say, “We told you so!” Happy “Hump” Day, Everyone!…