Fear & Greed Index – Investor Sentiment
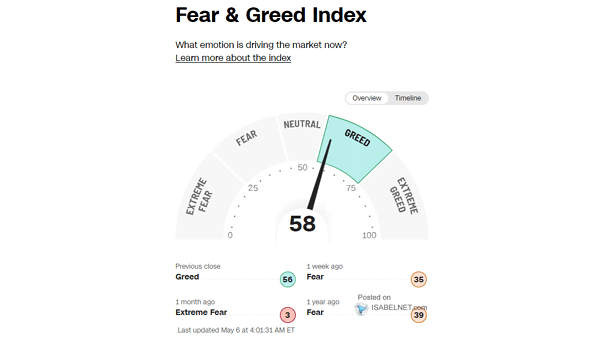
Fear & Greed Index – Investor Sentiment While extreme fear remains, the Fear & Greed Index has increased to 21, which is a positive sign. Image: Cable News Network
Fear & Greed Index – Investor Sentiment While extreme fear remains, the Fear & Greed Index has increased to 21, which is a positive sign. Image: Cable News Network
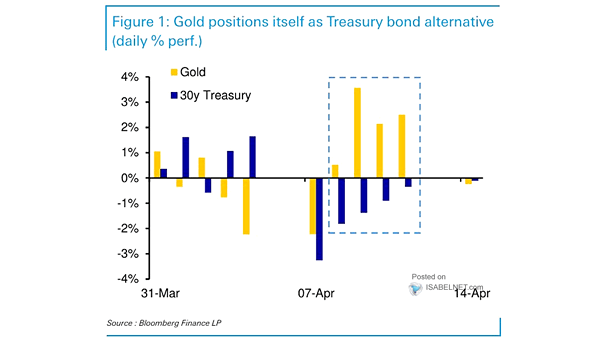
Gold vs. 30-Year U.S. Treasury Bond Gold is increasingly being positioned as an alternative to U.S. Treasury bonds. Image: Deutsche Bank

S&P 500 Index Wall Street analysts have sharply lowered their 2025 S&P 500 forecasts amid rising trade tensions and economic uncertainty; however, most still expect the index to finish the year with gains. Image: Bloomberg
Bloomberg Dollar Spot Index The U.S. dollar’s recent decline toward critical support levels stems from a confluence of factors, primarily driven by policy uncertainty and shifting investor sentiment. Image: Bloomberg
Brent Crude Oil Price Forecast Goldman Sachs projects Brent crude oil prices to average $63 per barrel through the end of 2025, with a decline to an annual average of $58 per barrel in 2026,…
ISABELNET Cartoon of the Day The S&P 500 took a 1.50% dip this week, but bears are open to talks if bulls show respect! Happy Easter Weekend, Everyone! 

New York Fed GDP Nowcast The New York Fed’s Q2 2025 GDP Nowcast has been revised downward to 2.61%, down from 2.62% the previous week. Image: Federal Reserve Bank of New York Click the Image…
U.S. New Private Housing Units Authorized by Building Permits and Recessions In March, building permits in the U.S. rose to 1.482 million, exceeding expectations. Historically, they tend to peak and then decline before economic recessions.…
NAAIM Exposure Index – Investor Sentiment A NAAIM Exposure Index reading of 35.16 suggests that, on average, active investment managers have a relatively low allocation to U.S. equities, which creates a contrarian bullish signal for…
Notional Volume Traded in Listed U.S. Equity Options Thanks to strong participation from both retail and institutional investors, U.S. equity options are seeing rising average daily trading volumes—a trend that shows no signs of slowing…
S&P 500 and Liquidity Increased aggregate U.S. liquidity generally acts as a tailwind for the U.S. stock market, potentially boosting equity prices. However, the Fed Liquidity Index currently shows the opposite dynamic. Image: Real Investment…