Different Market Sentiment Indicators

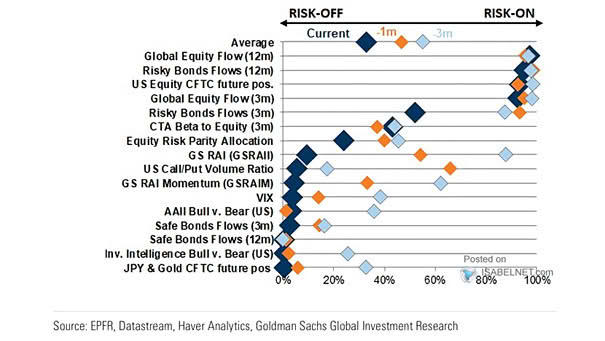
Different Market Sentiment Indicators By destabilizing markets and amplifying recession fears, Trump’s tariffs injected systemic risks into global trade, leading to dramatic shifts in investor sentiment and heightened market volatility. Image: Goldman Sachs Global Investment…

U.S. Real GDP Growth

U.S. Real GDP Growth Goldman Sachs now forecasts U.S. GDP growth at just 0.5% in 2025, sharply revised down due to increased financial and policy risks, highlighting concerns about a difficult and uncertain economic outlook…

ISABELNET Cartoon of the Day

ISABELNET Cartoon of the Day Of course bulls want to make a deal with bears—they think every dip is a clearance sale and every market crash is just a friendly game of “who can hold…

Fed Funds Rate and Fed Funds Futures

Fed Funds Rate and Fed Funds Futures Deutsche Bank expects the Fed to cut rates by 25 bps at the December 2025, January 2026, and March 2026 meetings, bringing the Fed funds rate to a…

Indexed S&P 500 Return – Market Hours vs. Overnight

Indexed S&P 500 Return – Market Hours vs. Overnight Overnight trading sessions account for almost all of the S&P 500’s recent downturn, overshadowing activity during normal U.S. trading hours. Image: Deutsche Bank Asset Allocation

World Technology vs. World Ex. TMT

World Tech + E-commerce vs. World ex-Tech & E-commerce The secular trend in the market has been deflation (credit & tech) dominating inflation, as $100 of EPS in 1995 is now $1,500 in the technology…

Median 2-Week S&P 500 Returns

Median 2-Week S&P 500 Returns Bulls have reason to be optimistic, as the S&P 500 has historically delivered strong positive performance during the final two weeks of April since 1950. Image: Goldman Sachs Global Investment…

U.S. 10Y-3M Yield Curve

U.S. 10Y-3M Yield Curve While a steepening inverted yield curve has historically served as a warning sign for U.S. recessions, its predictive power may be less definitive in this cycle. Image: J.P. Morgan

S&P 500 Index and Technical Score

S&P 500 Index and Technical Score The S&P 500’s current reading of 23.51 keeps it in technically oversold territory, suggesting a possible reflexive rally in the near term. Image: Real Investment Advice