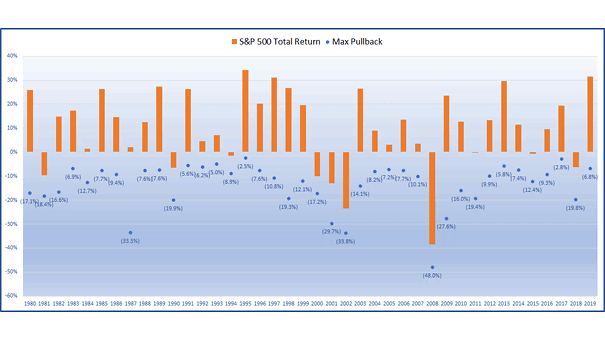
S&P 500 Total Return and Maximum Pullback

S&P 500 Total Return and Maximum Pullback In 2019, the S&P 500’s pullback (from peak to trough) of 6.8% was one of the smallest pullbacks in recent history. Image: Ryan Detrick, LPL Financial LLC

S&P 500 Net Debt vs. Share Buybacks

S&P 500 Net Debt vs. Share Buybacks U.S. companies are ramping up share buybacks. Funding is coming in part from a rise in debt. Image: Societe Generale Cross Asset Research

S&P 500 Volatility by Decade

S&P 500 Volatility by Decade Volatility ended this decade at a lower level than the previous decade. Image: Reuters

S&P 500 Returns by Decade

S&P 500 Returns by Decade The S&P 500 closes the decade with nearly 190% gain. Image: Financial Times

U.S. Unemployment Rate Forecast

U.S. Unemployment Rate Forecast Goldman Sachs forecasts new lows in the U.S. unemployment rate in 2020. Image: Goldman Sachs Global Investment Research

Annual Net Hedge Fund Openings

Annual Net Hedge Fund Openings Hedge funds are on track to record more closures than launches for the fifth consecutive year, due to mediocre returns and high fees. Image: Bloomberg