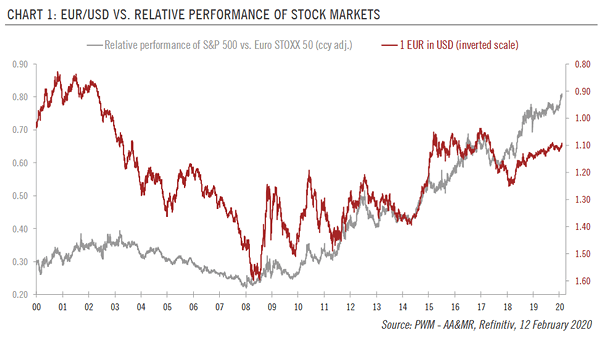
Share of IPOs with Positive Net Income in Year 1
Share of IPOs with Positive Net Income in Year 1 The IPO class of 2019 is the least profitable of any year since the internet bubble. Image: Goldman Sachs Global Investment Research
Global PMI Manufacturing and Rolling Yearly Change in the Balance Sheet (FED, ECB, BoJ, PBOC) This chart shows the correlation between the change in global liquidity and the global PMI manufacturing. Image: Swedbank Research
Small Caps: Russell 2000 Last 12 Month Performance Grouped by Stocks > 10-Years Old and < 2-Years Old Chart suggesting more alpha among “newer” Russell 2000 small cap stocks over the last 12 months. Image:…
Economy – Where People Are Losing Faith in Capitalism? Some countries appear to have more confidence in capitalism than others. Image: Statista
Calendar Year Performance During U.S. Presidential Election Years Presidential election years have historically been good for U.S. equities, when an incumbent president winds up winning reelection. Image: BlackRock Investment Institute
Technology Relative to Energy and Industrials Tech companies dominate the global market as never before since the internet bubble. Image: Financial Times
Share of Energy from Renewable Sources In the United States, renewable energy sources account for about 11% of total energy consumption. Image: Deutsche Bank Global Research
Sector Performance in the 9 Months Prior to Past U.S. Presidential Elections This chart shows the sector median excess return vs. the S&P 500 during 9 months before 11 presidential elections since 1976. Image: Goldman…
Wage Growth and U.S. Productivity (Leading Indicator) This chart suggests that wage growth tends to lead U.S. productivity by 21 months. Image: Pictet Asset Management
Average S&P 500 1-Year Performance Based on Valuation Starting Point The S&P 500 P/E ratio is over 18x currently. As valuations rise, expected returns fall. Image: Richardson Wealth
Forecast: Path of the S&P 500 in 2020 Goldman Sachs sees limited upside for the S&P 500 from current levels and set a price target of 3400 by the end of 2020. Image: Goldman Sachs