VIX Level and S&P 500 New Highs

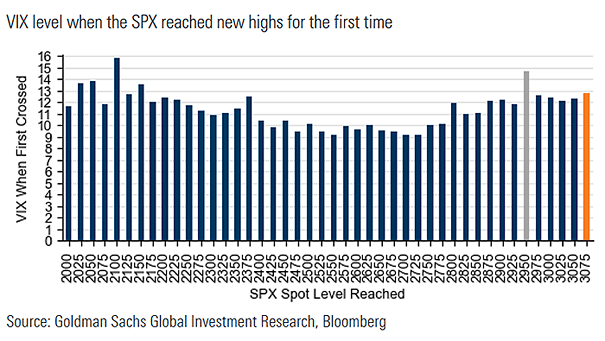
VIX Level and S&P 500 New Highs The VIX level when the S&P 500 reached new highs for the first time is rising. Image: Goldman Sachs Global Investment Research

Bull Market – U.S. Stocks-to-Bonds Ratio

Bull Market – U.S. Stocks-to-Bonds Ratio Chart showing the bull market in the U.S. stocks-to-bonds ratio. So far, the long-term support has held well. Image: BCA Research

Valuation – Commodity Prices Relative to S&P 500

Valuation – Commodity Prices Relative to S&P 500 Chart suggesting that commodity prices have never been more depressed relative to stocks, since the late 90’s. Image: U.S. Global Investors

Valuation – Value vs. Momentum Stocks

Valuation – Value vs. Momentum Stocks Chart suggesting that value stocks are currently very cheap vs. momentum stocks. The relative forward P/E of value vs. momentum is at two standard deviations below the average. Image:…

S&P 500 Next Twelve Month Equity Risk Premium

S&P 500 Next Twelve Month Equity Risk Premium Chart suggesting that the S&P 500 NTM equity risk premium remains well above its long-term average. Image: Morgan Stanley Research