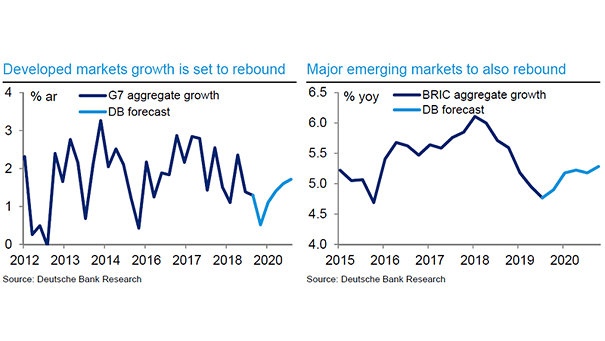
Developed and Major Emerging Markets Growth Forecast
Developed and Major Emerging Markets Growth Forecast Chart suggesting that growth in developed and major emerging markets should improve in 2020. Image: Deutsche Bank Global Research
Developed and Major Emerging Markets Growth Forecast Chart suggesting that growth in developed and major emerging markets should improve in 2020. Image: Deutsche Bank Global Research
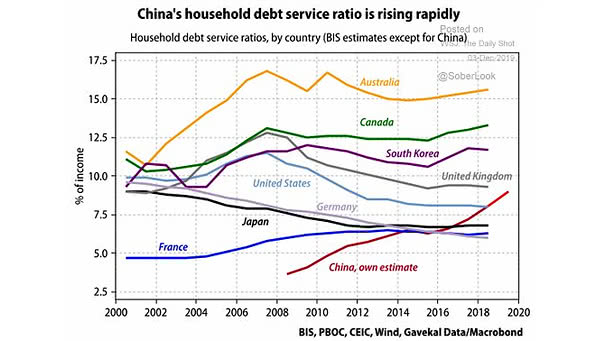
Household Debt Service Ratios by Country China’s household debt has grown rapidly in recent years. Image: Gavekal, Macrobond
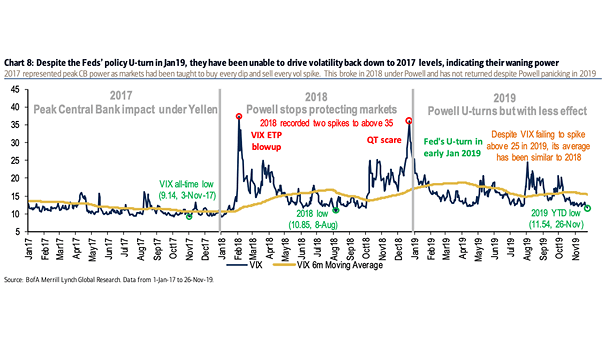
VIX and Fed Monetary Policy This year, the VIX average has been similar to 2018, despite Feds’ policy U-Turn in January. Image: BofA Merrill Lynch Global Research
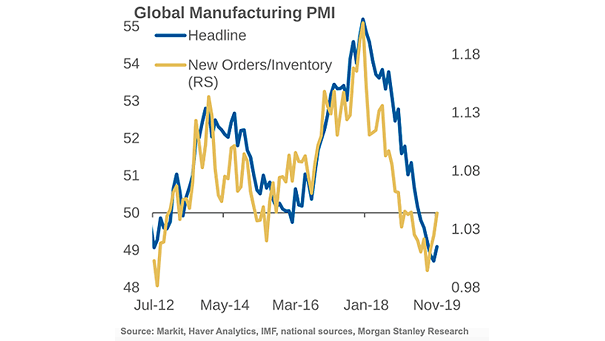
Global Manufacturing PMI and New Orders/Inventory Global Manufacturing PMI and new orders improved in November. Image: Morgan Stanley Research
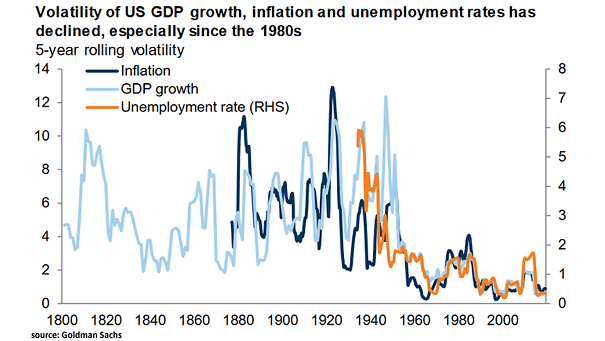
Volatility of U.S. GDP Growth, Inflation and Unemployment Rates Interesting chart showing the decline in volatility of the U.S. economy that occurred in the 1980s. Image: Goldman Sachs Global Investment Research
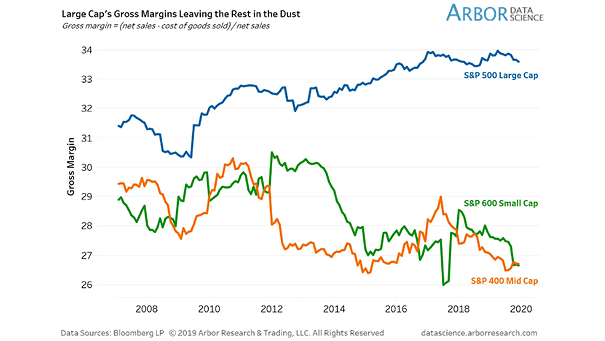
Gross Margin: S&P 500 Large Cap vs. S&P 600 Small Cap and S&P 400 Mid Cap Gross margins between large and small caps are widening. Industries with highest concentrations are getting all of the gross…
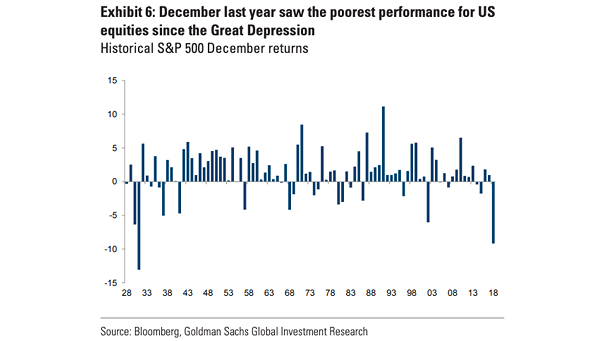
Historical S&P 500 December Returns December 2018 was the worst december for U.S. equities since the Great Depression. Image: Goldman Sachs Global Investment Research
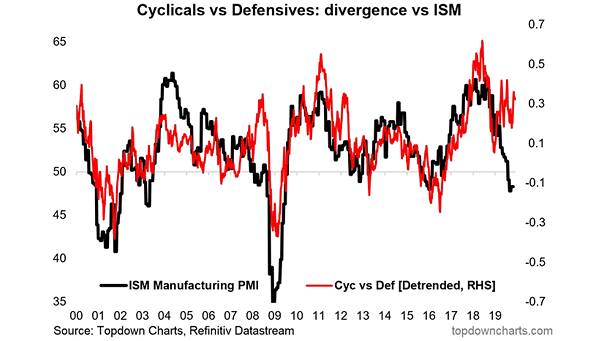
U.S. Cyclicals/Defensives vs. ISM Manufacturing PMI Chart showing the large divergence between U.S. cyclicals/defensives and the ISM Manufacturing PMI. Eventually, the gap should close soon. Image: Topdown Charts
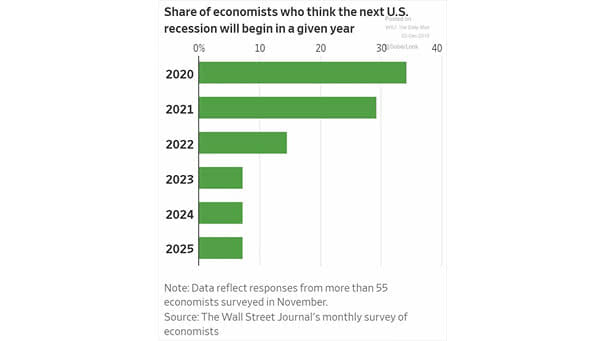
Economists and U.S. Recession More than 30% of economists predict a U.S. recession by 2020. Are economists good at predicting recessions? Image: The Wall Street Journal
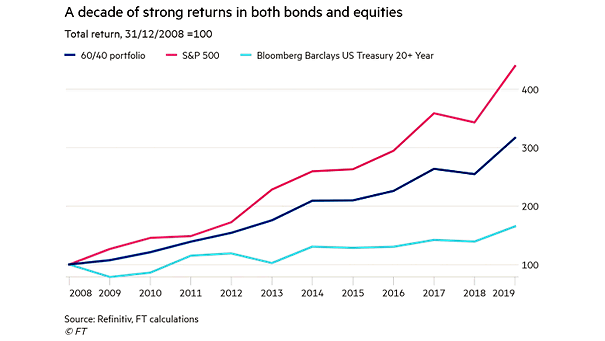
Total Return since 2008: 60/40 Portfolio, S&P 500 and U.S. Treasury 20+ Year The current bull market began 10 years ago, but the next 10 years could be very different. Image: Financial Times
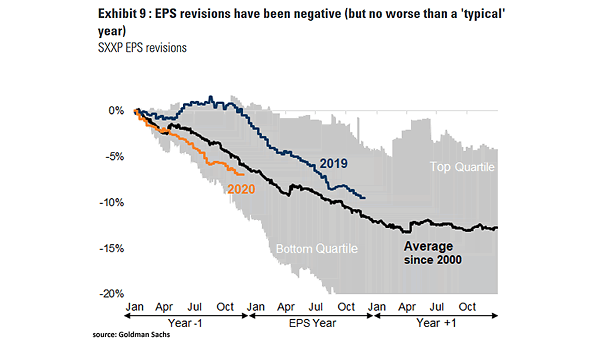
STOXX Europe 600 EPS Revisions This year, SXXP EPS revisions have not been worse than a typical year. Image: Goldman Sachs Global Investment Research