U.S. Population Growth
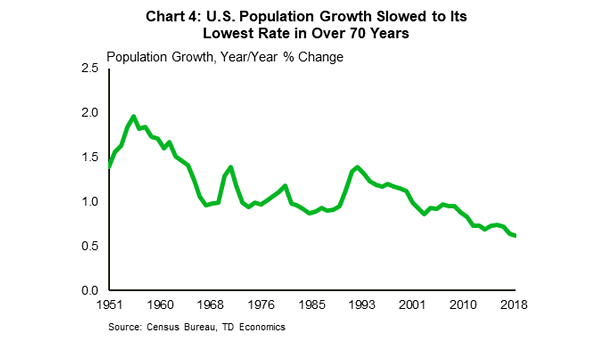
U.S. Population Growth U.S. population growth is slowing to its lowest rate, due to in large part to aging population. Improvements to immigration policies would greatly help the U.S. economy. Image: TD Bank Financial Group
U.S. Population Growth U.S. population growth is slowing to its lowest rate, due to in large part to aging population. Improvements to immigration policies would greatly help the U.S. economy. Image: TD Bank Financial Group
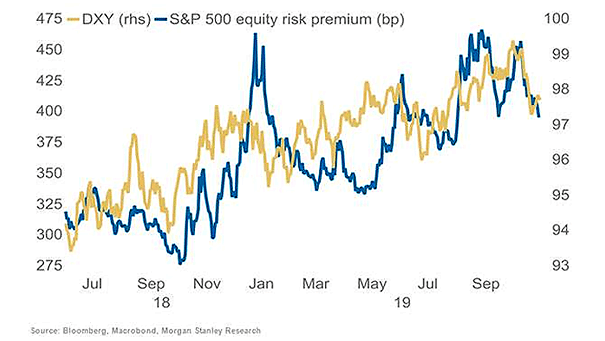
U.S. Dollar and S&P 500 Equity Risk Premium Higher bond yields reduce the S&P 500 equity risk premium, which weakens the U.S. dollar. Image: Morgan Stanley Research

Fed Rates Cut While The S&P 500 Traded Within 2% of a 4 Years All-Time High Don’t fight the Fed, when the Fed cuts rates while the S&P 500 trades at all-time highs. Image: Pictet…
U.S. IPO Activity Chart showing the fall in new listings, while WeWork’s abandoned IPO. Image: Financial Times
Percentage Point Contributions to U.S. Real GDP Growth Positive contributions from government spending contributed 1.67% points to real GDP in the first three quarters of 2019. That’s the highest since 2009. Image: Ned Davis Research
U.S. Consumer Confidence and CEO Confidence The trade war keeps weighing on CEO confidence, which is near record lows, while consumer confidence has remained relatively strong. Image: Goldman Sachs Global Investment Research
Private Sector Debt Private sector debt is high in China, extremely high in Sweden, and continues to rise. Source: Gavekal
Stocks, Bonds and Commodities Performance During U.S. Presidential Election Years Historically, since 1900, stocks and bonds have struggled in the first half of U.S. presidential election years. Image: Wells Fargo Investment Institute
Demographics – Labor Force Growth and Term Premium Chart suggesting that growth in the labor force could explain the term premium. The term premium is the risk premium (or the bonus) that investors receive for…
Inequality – Number of Millionaires by Country How many millionaires are in the U.S.? 18,614K millionaires, more than any other country in the world. Image: howmuch.net
U.S. Energy Balance Leads Oil-Dollar Correlation Interesting chart suggesting that the U.S. real energy balance leads the oil-dollar correlation by three years. Image: Oxford Economics, Macrobond