Global Growth Outlook (Global GDP)
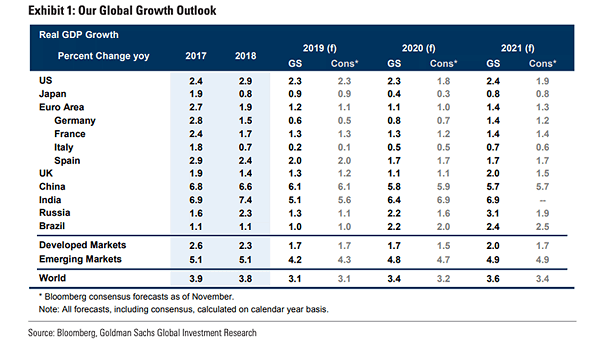
Global Growth Outlook (Global GDP) Goldman Sachs is optimistic and expects global growth to rise to 3.4% in 2020. Image: Goldman Sachs Global Investment Research
Global Growth Outlook (Global GDP) Goldman Sachs is optimistic and expects global growth to rise to 3.4% in 2020. Image: Goldman Sachs Global Investment Research
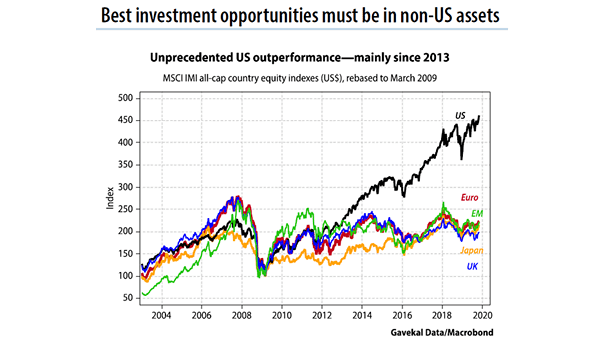
U.S. Equity Market Outperformance According to Gavekal, U.S. outperformance is mainly cyclical, not structural, and best investment opportunities could be in non-US assets. Image: Gavekal, Macrobond
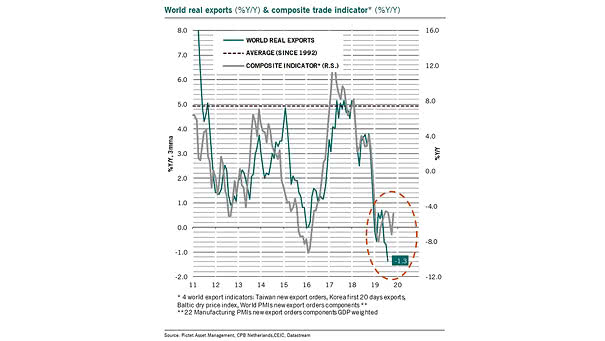
World Real Exports and Composite Trade Indicator Chart suggesting a recovery in world exports growth Image: Pictet Asset Management
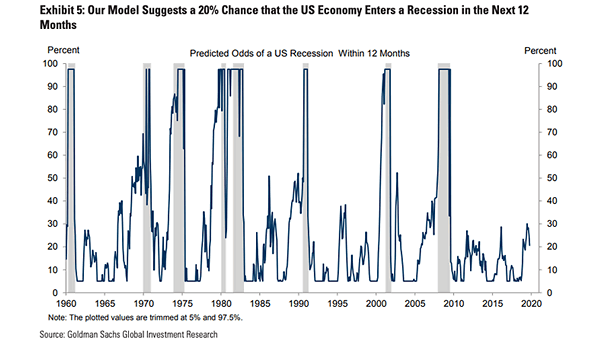
Predicted Odds of a U.S. Recession within 12 Months This chart suggests that the odds of a U.S. recession within 12 months have decreased to 20%. Image: Goldman Sachs Global Investment Research
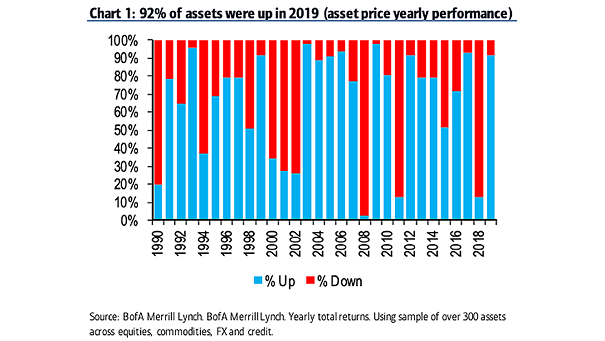
2019 Assets Performance 92% of more than 300 assets across equities, commodities, FX and credit are up this year, compared to less than 20% in 2018. Image: BofA Merrill Lynch
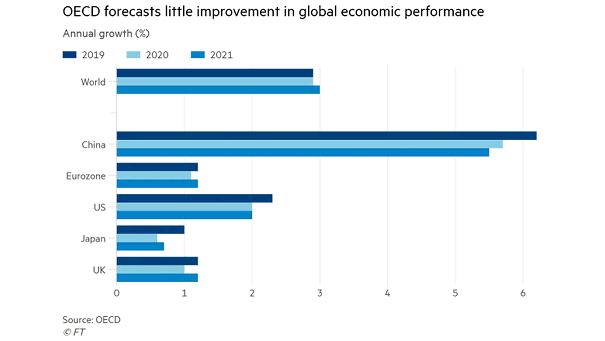
Global Economy – Annual GDP Growth Forecasts Weak global economic growth is expected to persist in 2020 and 2021. Image: Financial Times
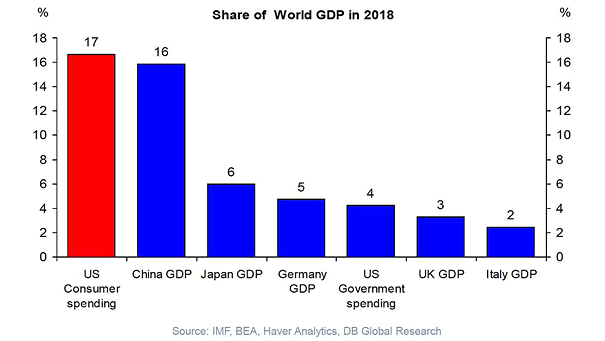
Share of World GDP U.S. consumption alone accounts for around 17% of word GDP, a larger share than the entire Chinese economy. Image: Deutsche Bank Global Research
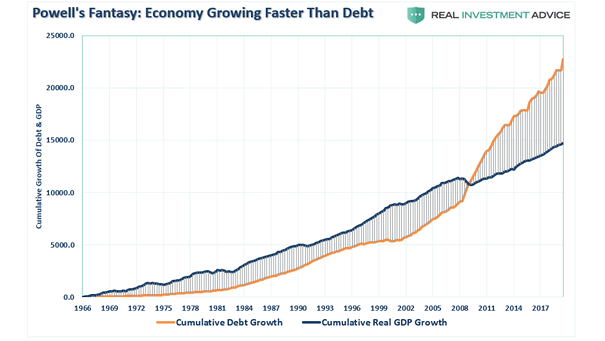
U.S. Debt Growth vs. Real GDP Growth Chart showing that the United States is on an unsustainable path, because U.S. debt is growing faster than the economy. Image: Real Investment Advice
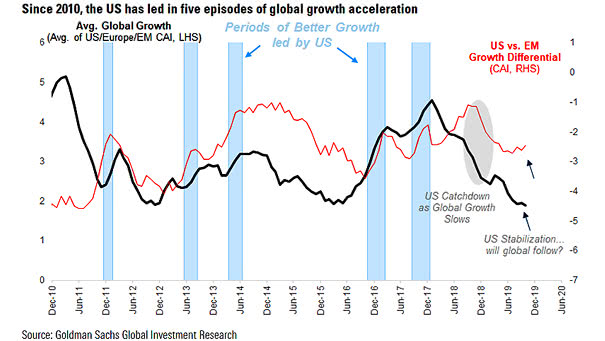
Global Growth and U.S. vs. Emerging Markets Differential The U.S. has led in several periods of global growth acceleration since 2010. Image: Goldman Sachs Global Investment Research
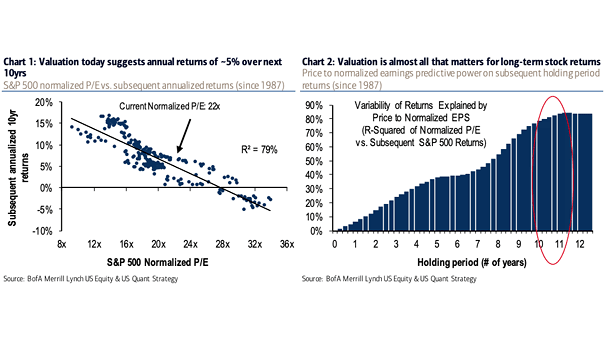
S&P 500 Normalized P/E vs. Subsequent Annualized Returns Chart suggesting annual returns of around 5% over the next 10 years (R² = 0.79). Image: BofA Merrill Lynch US Equity & US Quant Strategy
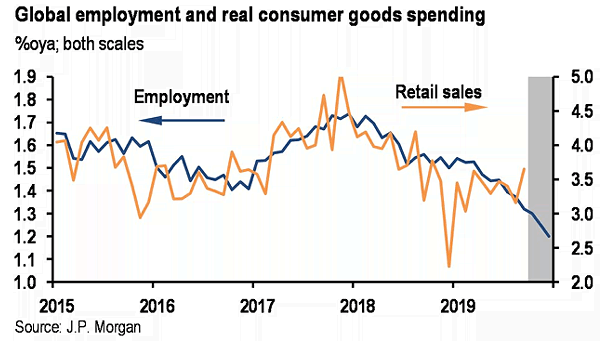
Global Employment and Global Real Retail Sales Chart suggesting that the slowdown in global employment is expected to impact global real retail sales. Image: J.P. Morgan