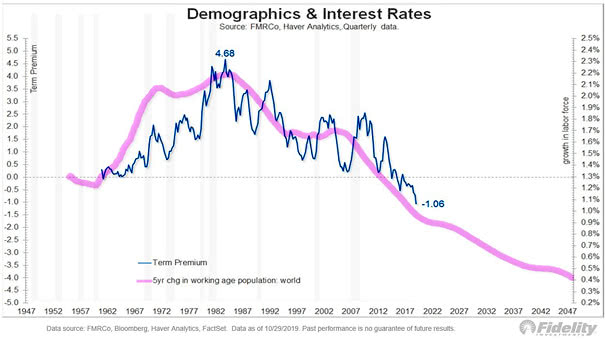
VIX and MOVE Rolling Correlation

VIX and MOVE Rolling Correlation Periods of high correlation between safe and risk assets are generally not good for balanced portfolios, because diversification is hard to find. Image: Arbor Research & Trading LLC

Yield Curve and Banks

Yield Curve and Banks A steeper yield curve helps banks to borrow more cheaply and lend at higher rates of interest. Image: Morgan Stanley

S&P 500 Value Index at All-Time High

S&P 500 Value Index at All-Time High Historically, when the S&P 500 Value Index made a new all-time high for the first time in 200+ days, it went higher 6 months later. Image: Sentimentrader

Asset Class Returns in YTD 2019

Asset Class Returns in YTD 2019 The S&P 500 Index, US Treasury bonds, gold and crude oil are all positive this year. This situation is quite rare. It never happened before, to have them all…

S&P 500 Employees

S&P 500 Employees Why S&P 500 companies aren’t so American? A large portion of S&P 500 employees works abroad. Image: Deutsche Bank Global Research

U.S. Equity Fund Flows vs. Bonds and Cash

U.S. Equity Fund Flows vs. Bonds and Cash This chart puts into perspective the rotation from equities to bonds and cash, as investors become cautious about further growth. Image: Goldman Sachs Global Investment Research

Health Care: Uninsured Rate

Health Care: Uninsured Rate Chart showing that the uninsured rate was down until the last year. Image: Deutsche Bank Global Research

S&P 500 and Seasonal Rotation Strategy

S&P 500 and Seasonal Rotation Strategy Sell in May and go away? This chart suggests that a rotation between defensive and cyclical sectors was a much better strategy Image: CFRA, S&P Global