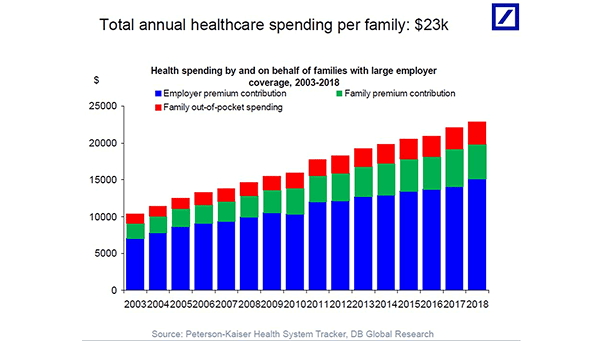
Total Annual Health Care Spending Per U.S. Family
Total Annual Health Care Spending Per U.S. Family Headlines say there’s no inflation, but U.S. health care costs have skyrocketed. The annual health care cost for U.S. families is $23,000 vs. $10,000 in 2003. Image:…