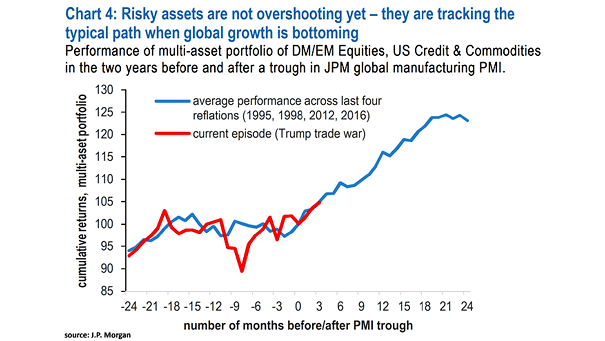
Rallies in World Cyclicals vs. Defensives

Rallies in World Cyclicals vs. Defensives Since the global financial crisis, average rallies in world cyclicals vs. defensives have lasted only four months. Image: Goldman Sachs Global Investment Research

U.S. Real GDP and Productivity

U.S. Real GDP and Productivity The U.S. economy is slowing down and productivity falls by most since 2015. Is the drop in productivity temporary? Image: Oxford Economics

60/40 Portfolio – Bull and Bear Markets

60/40 Portfolio – Bull and Bear Markets This is the longest bull market for balanced equity/bond portfolios in over a century, without a 10% total return drawdown. Image: Goldman Sachs Global Investment

Recessions Length in Quarters

Recessions Length in Quarters Historically, recessions tend to be two or three quarters. Image: Oxford Economics

U.S. Stock-to-Bond Ratio Leads U.S. Real GDP

U.S. Stock-to-Bond Ratio Leads U.S. Real GDP Chart suggesting that the U.S. stock-to-bond ratio leads U.S. real GDP by 6 months, which could indicate higher GDP growth. Image: Alpine Macro