Emerging Markets Credit Growth
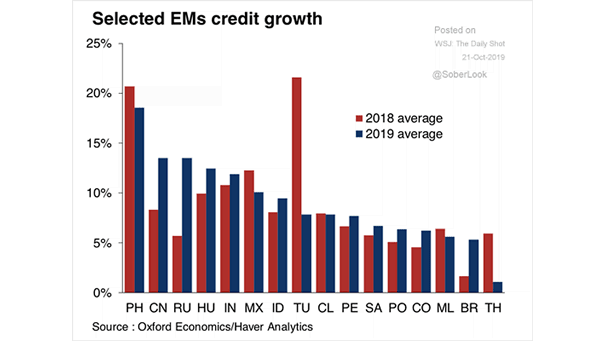
Emerging Markets Credit Growth Chart showing that credit growth in most emerging markets is still growing at a sustained pace. Image: Oxford Economics
Emerging Markets Credit Growth Chart showing that credit growth in most emerging markets is still growing at a sustained pace. Image: Oxford Economics
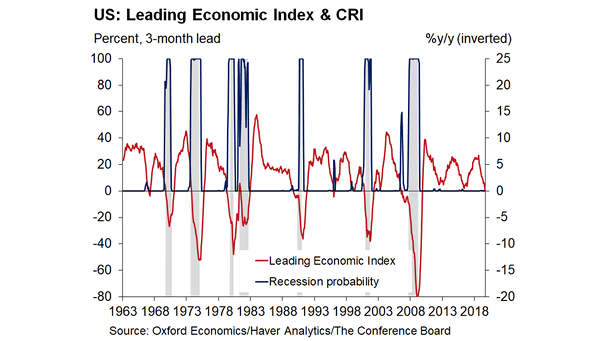
U.S. Leading Economic Index (LEI) and Calibrated Recession Index The Calibrated Recession Index suggests a low probability of U.S. recession over the next 4-6 months. U.S. recession odds for 2020 are 40%. Image: Oxford Economics

60/40 Portfolio Annual Returns A 60/40 portfolio has delivered an annualized return of 10.15% since 1976, with positive returns in 35 of 43 years. But the coming years may be more challenging, because investors may face…
Passive Equity Fund Assets vs. Active Record passive inflows suggest passive equity funds will surpass active by 2022. Image: BofA Merrill Lynch
Chinese Credit Growth and OECD Leading Indicator for China Chinese Credit growth rebounded in September and suggests stronger activity on the horizon. The OECD leading indicator for China picked up further at the highest level…
U.S. Dollar and U.S. ISM Manufacturing Index Chart suggesting that sharp falls in the ISM Manufacturing Index are associated with U.S. dollar strength, not weakness. Image: HSBC
S&P 500 Cash Spending According to Goldman Sachs, cash spending by S&P 500 companies is likely to fall by 6% in 2019, the largest year-over-year decline since 2009. Image: Goldman Sachs Global Investment Research
Fears of Global Recession The latest BofAML’s European credit investor survey shows that fears of global recession have risen to 42%. Image: BofA Merrill Lynch
S&P 500 Performance When Market Is Up 17% Through Oct. 15 When the S&P 500 is up 17% through October 15, the average gain through year-end is 3.1%, 82% of time since 1930. Image: Fundstrat…
Trade-Weighted U.S. Dollar vs. U.S. 10Y-2Y Yield Curve A support for U.S. dollar bears could be a significant Fed easing, resulting in a steeper yield curve. Image: Saxo Bank
Shareholder Return vs. Free Cash Flow Thanks to low interest rates, shareholder return has exceeded free cash flow levels again. U.S. companies cannot spend more than they earn indefinitely. Image: Goldman Sachs Global Investment Research