Volatility – Bond Proxies and Long-End Treasuries
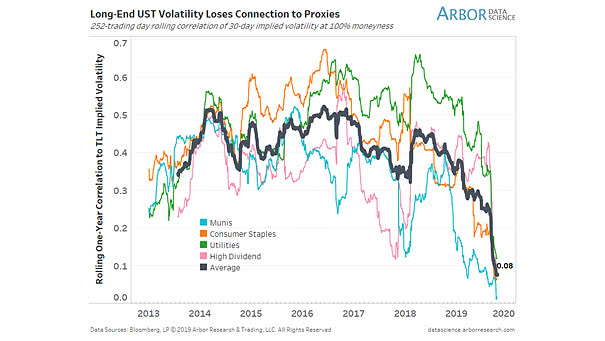
Volatility – Bond Proxies and Long-End Treasuries Bond proxies are less attached to Fed policy. This chart shows that the implied volatility of bond proxies is disconnected from long-end Treasuries. Image: Arbor Research & Trading…