Inflation – Price Changes Over the Last 20 Years in the U.S.
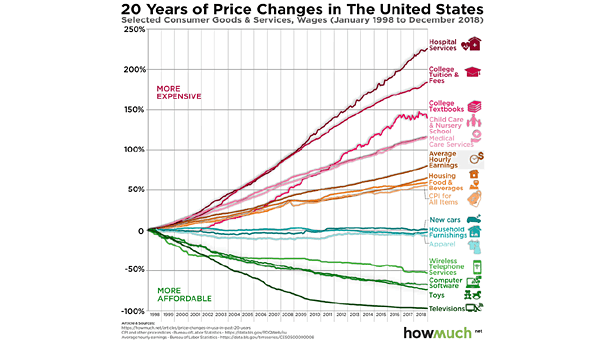
Inflation – Price Changes Over the Last 20 Years in the U.S. Most important things in life are getting more expensive, while toys are getting more affordable. Image: howmuch.net
Inflation – Price Changes Over the Last 20 Years in the U.S. Most important things in life are getting more expensive, while toys are getting more affordable. Image: howmuch.net
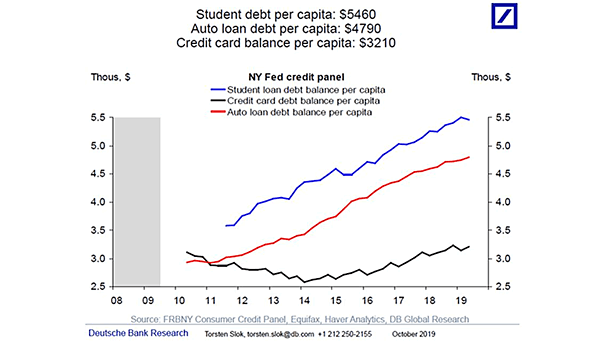
U.S. Student Debt, Auto Loan Debt, Credit Card Balance, per Capita Household debt balances have been rising steadily in recent years. Image: Deutsche Bank Global Research

Nasdaq 100 and S&P 500 Seasonality The Nasdaq 100 and S&P 500 seasonality chart from 1985 to 2018 (excluding 2008). This is not a forecast. Image: Goldman Sachs
The Performance of “Deflation Assets” vs. “Inflation Assets” Interesting chart showing the performance of “Deflation Asset” vs. “Inflation Assets” since 1960. “Deflation Assets”: Government Bonds, US Investment Grade, S&P 500, US Consumer Discretionary, Growth and…
Dividend Yield of MSCI ACWI Stocks Currently, more than 1,100 global stocks are paying dividends above the average yield of global government bonds. Image: BofA Merrill Lynch
U.S. Recessions by Decade This could be the first decade in history wherein the U.S. economy doesn’t experience a recession. Image: Crestmont Research
U.S. Retail Sales and Food Services vs. Fair Value Model After disappointing U.S. retail sales in September, this chart provides a good forward guide for U.S. consumer spending. The Fair Value Model leads consumption and…
Risk-Adjusted Returns Across the Treasury Strips Curve The distribution of strong returns across the Treasury curve has become very tight. Historically, this marks the beginning of the end. Image: Arbor Research & Trading LLC
Cumulative Fund Flows: Global Equities and Global Government & Corporate Bonds $339 billion in inflows to bond funds globally, and $208 billion in outflows from global equity funds in 2019, as investors fear a global recession…
Proportion of Unprofitable IPOs The proportion of unprofitable IPOs has reached 70%, the highest level since the tech bubble 20 years ago. Image: BofA Merrill Lynch
U.S. Dollar and Growth in the Rest of the World vs. U.S. GDP Growth Chart suggesting that the U.S. dollar could weaken in a scenario of a global economy recovery. Image: Morgan Stanley Research