New Home Sales vs. Recessions
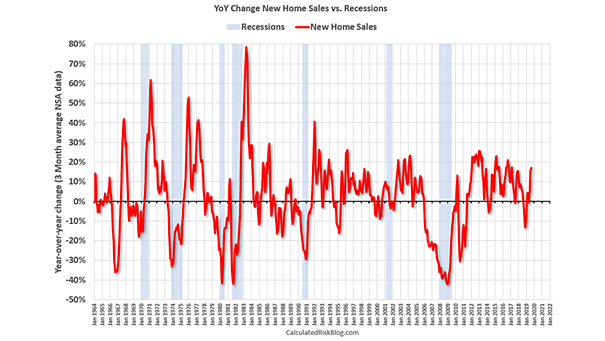
New Home Sales vs. Recessions Typically, a recession occurs when the annual change in New Home Sales declines by about 20%. This chart suggests that a recession from these levels would be surprising. Image: Calculated…
New Home Sales vs. Recessions Typically, a recession occurs when the annual change in New Home Sales declines by about 20%. This chart suggests that a recession from these levels would be surprising. Image: Calculated…
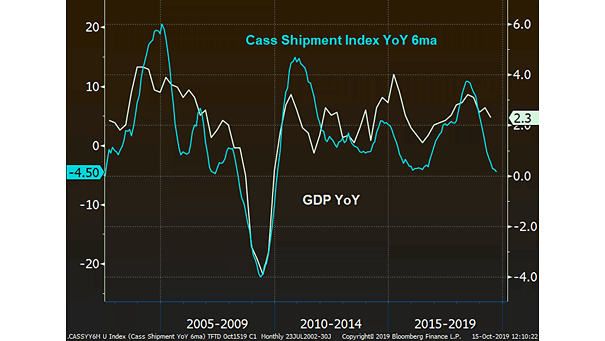
Cass Freight Shipments Index (6ma) vs. U.S. GDP The chart shows the Cass Freight Shipments Index (6-month average). It suggests a weakness in U.S. GDP in 3Q19. The Cass Freight Shipments Index is a relative…

Dividends and Buybacks vs. Free Cash Flow Dividends and buybacks have exceeded free cash flow levels again, thanks to low interest rates. But companies cannot spend more than they earn forever. Image: Capital Group
The Highest-Paying U.S. Companies by Median Salary Most highest-paying American companies are in the tech sector. Image: howmuch.net
Federal Reserve Money Supply M2 Leads Global Manufacturing PMI Chart suggesting that the Federal Reserve money supply M2 leads global manufacturing PMI by 18 months. Image: Nordea and Macrobond
S&P 500 Hedge Fund Long Positioning Speculative long positions in the S&P 500 are near levels that have marked major bottoms in the past. Image: Macro Ops
Blue Chip Economic Indicators Surveys and Average Probability of U.S. Recession The probability of U.S. recession increases to 39% for 2020, based on Blue Chip Economic Indicators surveys. Image: J.P. Morgan
MSCI World Index Valuation at Cycle Peaks and Troughs On average, the MSCI World Index currently trades at a price-to-earnings ratio that has marked cyclical peaks in the stock market over the past 50 years.…
Demographics – U.S. 10-Year Rate, Labor Force Growth and Nominal GDP Growth Chart suggesting that the current trend in labor force growth and nominal GDP growth points to higher rates. Image: Swedbank Research
Money Market Fund Flows and Probability of Recession Investors move to safe assets by raising their cash holdings, like 2007/2008. This chart suggests that the probability of a recession in the next 12 months is…
Recessions After U.S. 10Y-3M Yield Curve Inversion and S&P 500 Market Peaks Prior to NBER Recessions Analysis based on the 10Y-3M yield curve inversion, suggesting the S&P 500 peak-to-trough in percentage terms, and NBER recession…