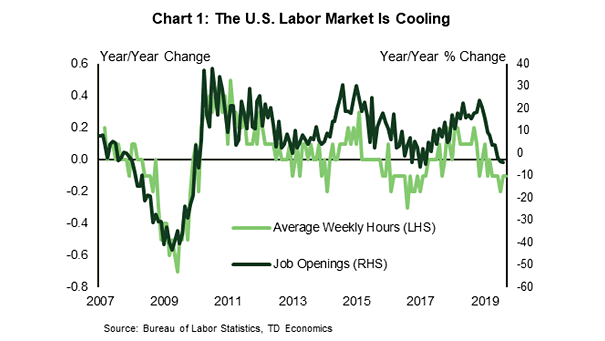
S&P 500 and ISM Composite PMI

S&P 500 and ISM Composite PMI At current levels, the U.S. market is pricing in a strong rebound in the ISM Composite PMI rising to 57. Image: Deutsche Bank Asset Allocation

U.S. Equity Flows and S&P 500

U.S. Equity Flows Chart showing that money is once again flowing slightly into equity funds and ETFs. Image: Fidelity Investments

MSCI ACWI and Global Composite PMI

MSCI ACWI and Global Composite PMI Chart suggesting that global equities expect a pickup in global growth, as policy stimulus takes effect. Image: Morgan Stanley Research

Simple U.S. Risk Parity Strategy

Simple U.S. Risk Parity Strategy Risk parity strategies performed very well this year. Image: Goldman Sachs Global Investment Research