S&P 500 Historical Performance in Different Yield Curve Regimes
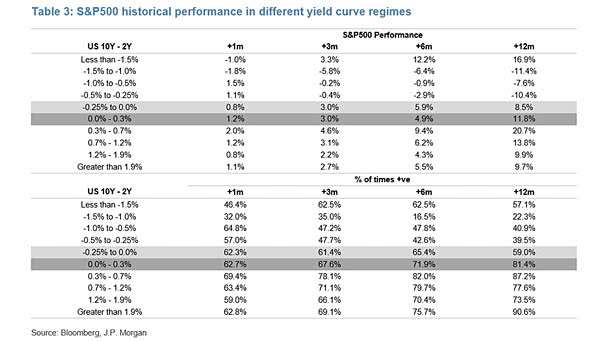
S&P 500 Historical Performance in Different Yield Curve Regimes Great table showing the U.S. 10Y-2Y Treasury spread and the S&P 500 historical performance. Image: J.P. Morgan
S&P 500 Historical Performance in Different Yield Curve Regimes Great table showing the U.S. 10Y-2Y Treasury spread and the S&P 500 historical performance. Image: J.P. Morgan
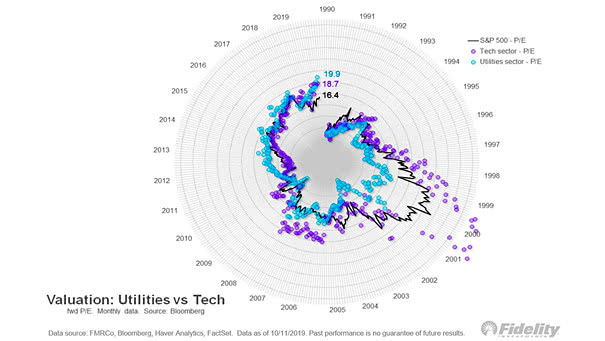
Valuation: Utilities vs. Tech vs. S&P 500 Nice chart showing the valuation of utilities vs. Tech and the S&P 500. Currently, utilities are valued at 19.9x forward EPS, tech at 18.7x, and the S&P 500…

A Breakdown of the Average American Spending Consumer spending drives 68% of the U.S. economy and affects U.S. GDP. Image: howmuch.net
China GDP Growth China GDP growth is expected to continue to decline significantly in the coming years, with consumption becoming the main driver of growth. Image: Danske Bank Research
Commercial Bank – Credit Cards Interest Rate In the United States, the average credit card interest rate is 17.39%, at highest level in decades. Is the U.S. consumer doing well? Image: Deutsche Bank Global Research
Year to Date Performance Nice chart showing that REITs, large growth, S&P 500, gold and bonds perform best, through September. Image: Fidelity Investments
San Francisco Fed Leading Unemployment Rate Does the San Francisco Fed Leading Unemployment Rate signal a turning point in the U.S. labor market? Image: Merk Investments
Hotel CPI (Inflation) Interesting chart showing that hotel CPI appears to be disconnected. Is the U.S. consumer doing well? Image: Quill Intelligence, LLC
Growth and Inflation This chart shows the ISM Index vs. prices paid deviation from the mean since 2009. Currently, the U.S. manufacturing cycle has headed back into recession & deflation. Image: Fidelity Investments
The Trade War Cycle The following picture helps to understand Trump’s trade war tactics. Image: StockCats
S&P 500 Return – Longest Bull Markets Ever Chart showing the longest equity bull markets ever. October 9, 2019 was the bottom in 2002 and peak in 2007. Image: Ryan Detrick, LPL Financial LLC