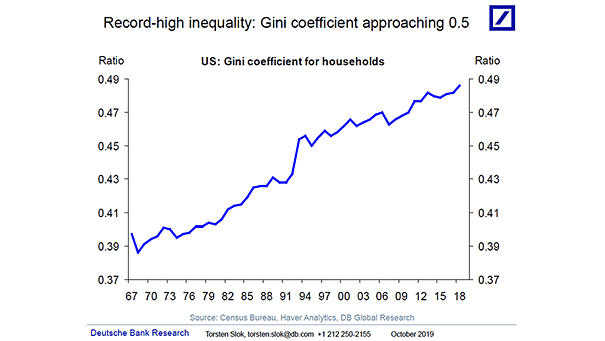
NFIB Survey Leads U.S. Employment
NFIB Survey Leads U.S. Employment The U.S. economy is not unaffected by the trade war and global slowdown. This chart suggests that U.S. employment is slowing down. The chart also suggests that the NFIB survey…
How Much Do the FAANMGs Matter to the S&P 500 since 1/26/18? FAANMG stocks pushed S&P 500 up 2.24%, and other stocks (S&P 500 less FAANMG) pushed S&P 500 down 2.55%. Image: Bianco Research
China GDP and China Credit Impulse The chart shows the correlation between credit impulse and China GDP. Credit impulse is the change in new credit issued as a percentage of GDP. The chart also suggests…
S&P 500 vs. 12-Month Forward EPS Estimate Chart suggesting that the 52-week rate-of-change in forward EPS could turn negative. Image: Lohman Econometrics
World Trade Growth Chart showing that world trade growth is now at its lowest level since 2009. Image: BofA Merrill Lynch
U.S. Dollar and Global Liquidity In 2018, global liquidity fell at the fastest rate since the global financial crisis. This chart suggests that a reversal in global liquidity lies ahead. Image: Swedbank Research
Yield Comparison – S&P 500 Didivend Aristocrats and 10-Year U.S. Treasury S&P 500 dividend aristocrats are once again higher than 10-year U.S. Treasuries. Image: Legg Mason
Is Inflation Dead? Deflation Fears Make A Comeback Is deflation on the horizon? Investors expect inflation running below 1.5% YoY for the next three years. Image: Arbor Research & Trading
U.S. ISM Manufacturing Index and Cyclical Stocks Great chart showing that cyclical stocks suggest an economic slowdown rather than an imminent recession. Image: The Leuthold Group
Global Manufacturing PMI Above 50 Is the worst over for global manufacturing PMI? This interesting chart shows the percentage of global manufacturing PMI above 50. Image: FactSet, IHS Markit, Charles Schwab
U.S. ISM PMI Composite Index and U.S. Real GDP Chart showing the correlation between the U.S. ISM PMI Composite Index and U.S. real GDP. The service sector is still expanding. Image: Oxford Economics