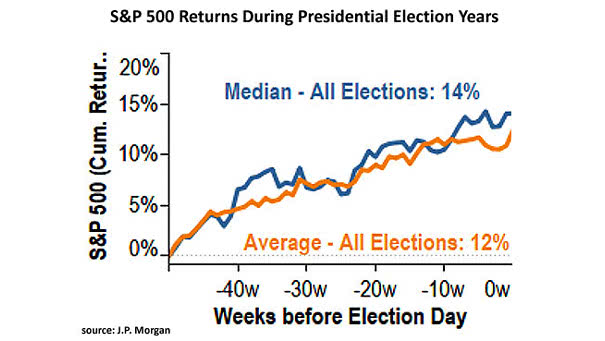
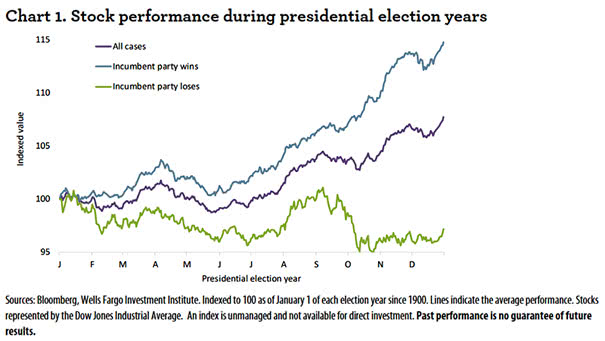
Dow New All-Time Highs Per President

Dow New All-Time Highs Per President Interesting chart showing that Dow new all-time highs have varied significantly under each president. Image: Ryan Detrick, LPL Financial LLC Click the Image to Enlarge

Average Valuation Percentile: Equity, Bond, Credit

Average Valuation Percentile: Equity, Bond, Credit Chart suggesting that credit and equities look expensive, while bonds are the most expensive. Image: Goldman Sachs Global Investment Research

NFIB Hiring Plans vs. S&P 500

NFIB Hiring Plans vs. S&P 500 Chart showing the correlation between NFIB hiring plans and the S&P 500. Image: Pervalle Global

Inflows to Emerging Market Equity Funds

Inflows to Emerging Market Equity Funds Investors are back into emerging markets equities. This is the biggest 4-week inflows to emerging market equity funds since January 2019. Image: BofA Merrill Lynch Global Research