U.S. vs. China – Number of Listed Companies, IPO
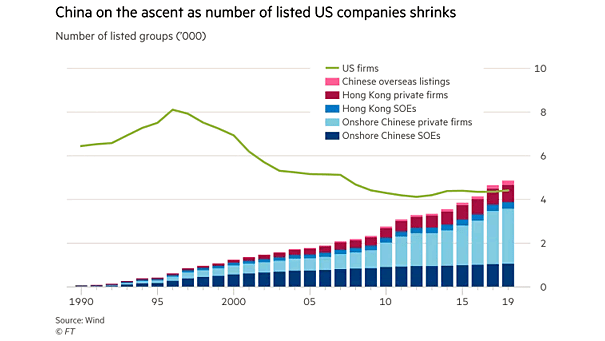
U.S. vs. China – Number of Listed Companies, IPO There are fewer firms listed on U.S. exchanges than 20 years ago. And the U.S. has also fewer listed public companies than China. Image: Financial Times