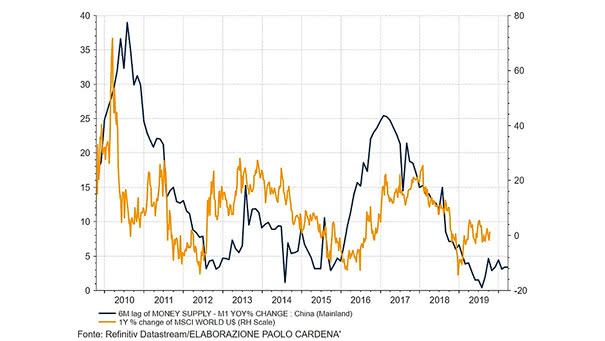
China M1 Money Supply Growth Leads MSCI World Index
China M1 Money Supply Growth Leads MSCI World Index Chart suggesting that China M1 money supply growth leads the MSCI World Index by 6 months. Image: Paolo Cardena
China M1 Money Supply Growth Leads MSCI World Index Chart suggesting that China M1 money supply growth leads the MSCI World Index by 6 months. Image: Paolo Cardena
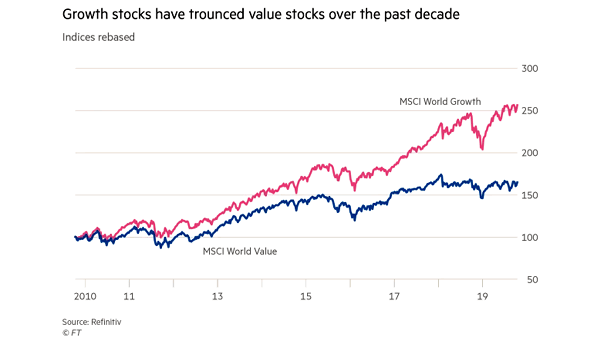
MSCI World Growth Index vs. MSCI World Value Index Over the past decade, global value stocks have remained in the shadow, while the sun has shone on global growth stocks. Image: Financial Times
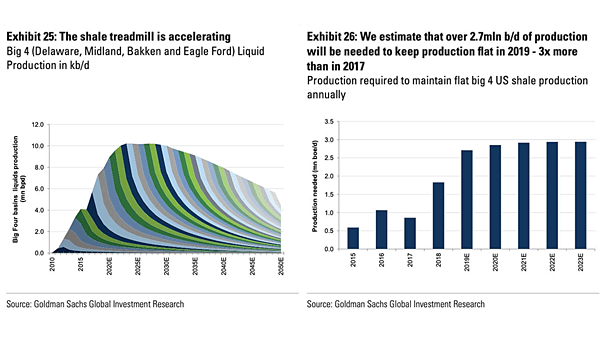
The Treadmill of U.S. Oil Shale Chart suggesting that the treadmill of U.S. shale is accelerating. Image: Goldman Sachs Global Investment Research
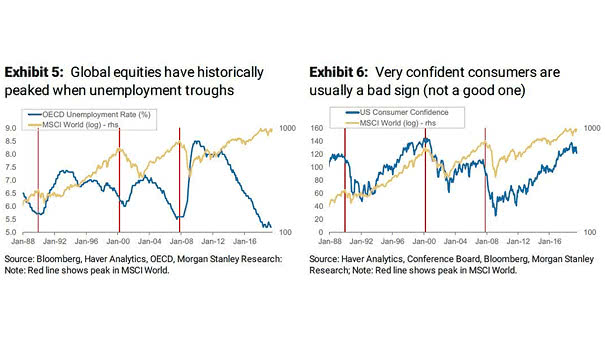
MSCI World Index vs. OECD Unemployment Rate and U.S. Consumer Confidence Chart suggesting that OECD unemployment troughs and very confident U.S. consumers do not generally bode well for global equities. Image: Morgan Stanley Research
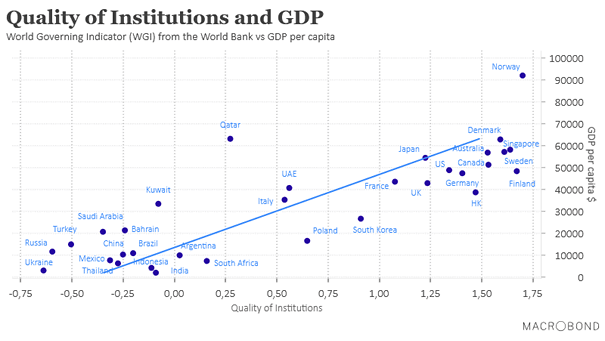
Quality of Institutions and GDP This interesting chart shows how six components of quality of governance control of corruption, (governement effectiveness, stability and absence of violence, regulatory quality, rule of law, voice and accountability) correspond…
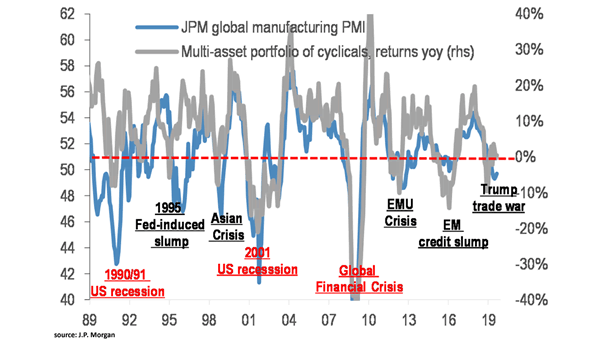
Global Manufacturing PMI and Multi-Asset Portfolio of Cyclicals Using global manufacturing PMI to trade cyclicals in different business cycle phases. Image: J.P. Morgan
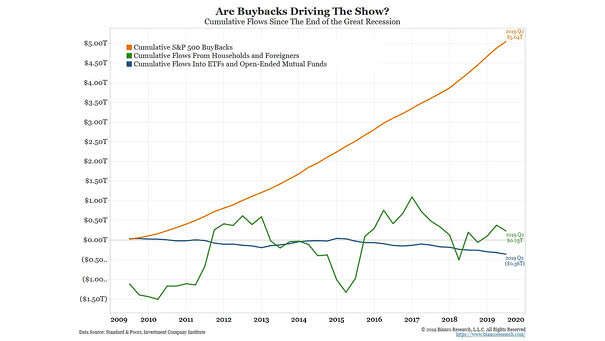
Cumulative S&P 500 Buybacks 2009-2019 Are buybacks driving the show? Thanks to tax cuts and low interest rates, corporate stock buybacks are booming. Over the past decade, S&P 500 companies bought back $5 trillion shares, while cumulative…
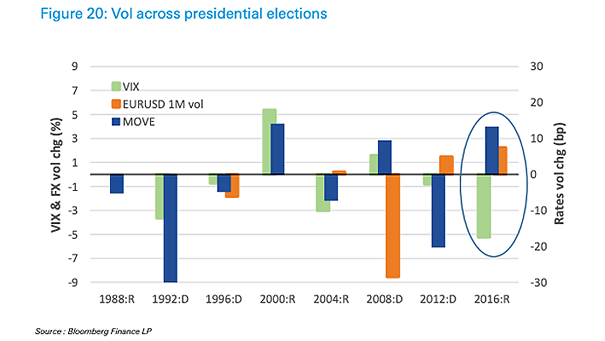
Volatility Across U.S. Presidential Elections Chart showing that outside of recessions, U.S. presidential elections did not contribute much to the volatility of equities, rates and forex. Image: Deutsche Bank Global Research
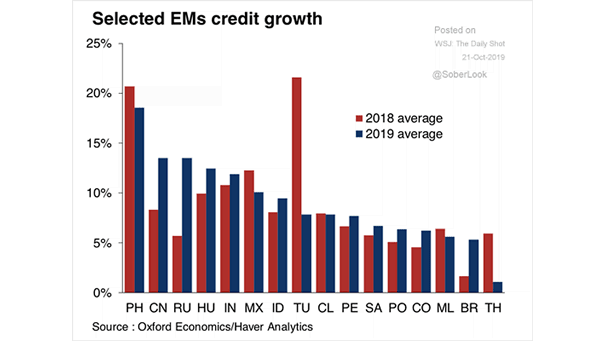
Emerging Markets Credit Growth Chart showing that credit growth in most emerging markets is still growing at a sustained pace. Image: Oxford Economics
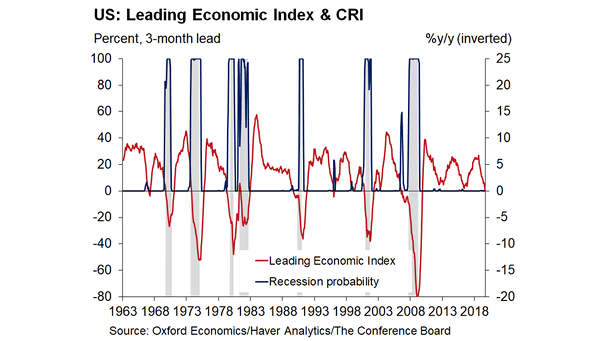
U.S. Leading Economic Index (LEI) and Calibrated Recession Index The Calibrated Recession Index suggests a low probability of U.S. recession over the next 4-6 months. U.S. recession odds for 2020 are 40%. Image: Oxford Economics
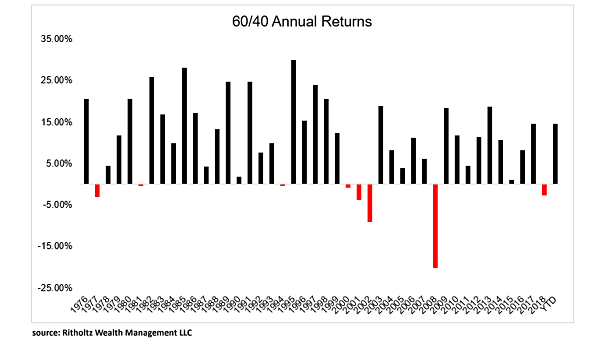
60/40 Portfolio Annual Returns A 60/40 portfolio has delivered an annualized return of 10.15% since 1976, with positive returns in 35 of 43 years. But the coming years may be more challenging, because investors may face…