U.S. Recessions by Decade
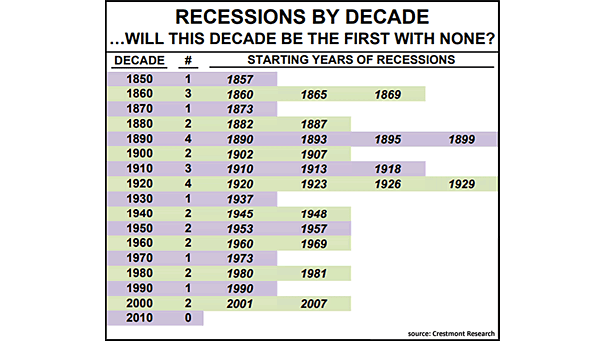
U.S. Recessions by Decade This could be the first decade in history wherein the U.S. economy doesn’t experience a recession. Image: Crestmont Research
U.S. Recessions by Decade This could be the first decade in history wherein the U.S. economy doesn’t experience a recession. Image: Crestmont Research
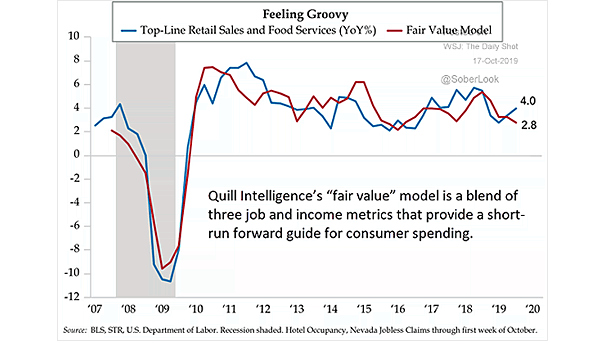
U.S. Retail Sales and Food Services vs. Fair Value Model After disappointing U.S. retail sales in September, this chart provides a good forward guide for U.S. consumer spending. The Fair Value Model leads consumption and…
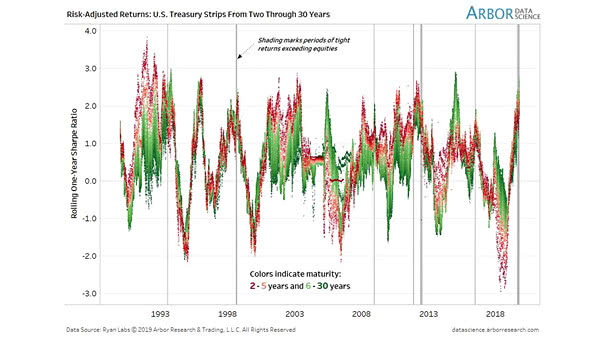
Risk-Adjusted Returns Across the Treasury Strips Curve The distribution of strong returns across the Treasury curve has become very tight. Historically, this marks the beginning of the end. Image: Arbor Research & Trading LLC
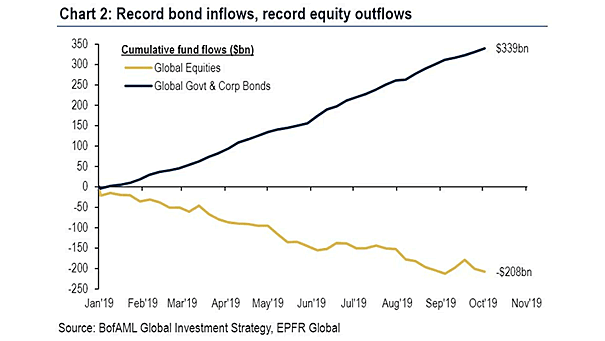
Cumulative Fund Flows: Global Equities and Global Government & Corporate Bonds $339 billion in inflows to bond funds globally, and $208 billion in outflows from global equity funds in 2019, as investors fear a global recession…
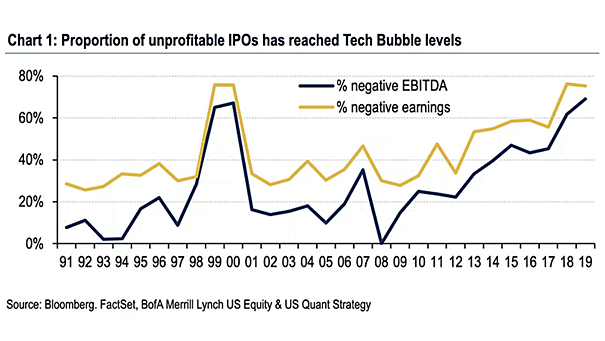
Proportion of Unprofitable IPOs The proportion of unprofitable IPOs has reached 70%, the highest level since the tech bubble 20 years ago. Image: BofA Merrill Lynch
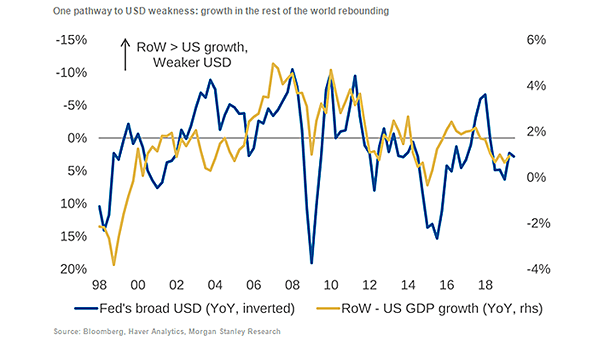
U.S. Dollar and Growth in the Rest of the World vs. U.S. GDP Growth Chart suggesting that the U.S. dollar could weaken in a scenario of a global economy recovery. Image: Morgan Stanley Research
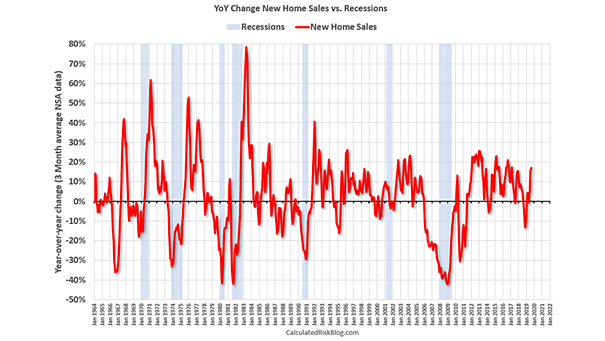
New Home Sales vs. Recessions Typically, a recession occurs when the annual change in New Home Sales declines by about 20%. This chart suggests that a recession from these levels would be surprising. Image: Calculated…
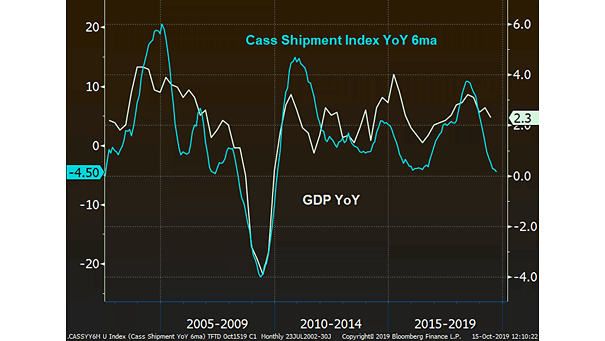
Cass Freight Shipments Index (6ma) vs. U.S. GDP The chart shows the Cass Freight Shipments Index (6-month average). It suggests a weakness in U.S. GDP in 3Q19. The Cass Freight Shipments Index is a relative…
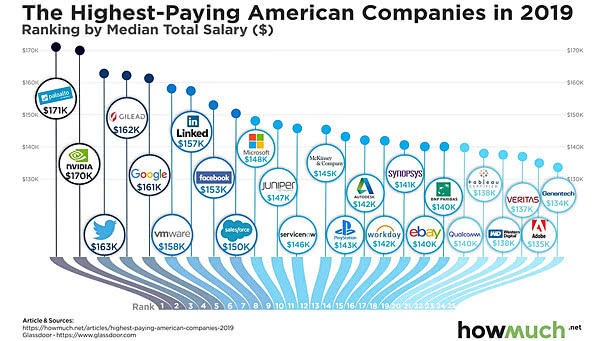
The Highest-Paying U.S. Companies by Median Salary Most highest-paying American companies are in the tech sector. Image: howmuch.net
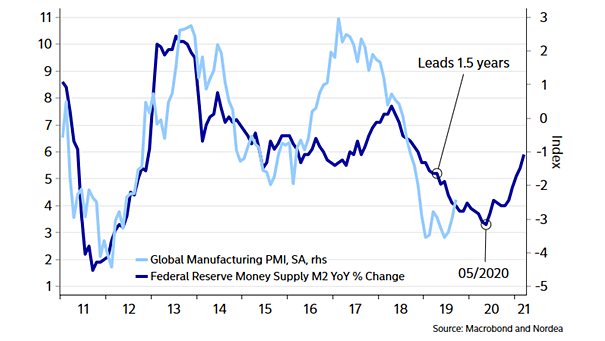
Federal Reserve Money Supply M2 Leads Global Manufacturing PMI Chart suggesting that the Federal Reserve money supply M2 leads global manufacturing PMI by 18 months. Image: Nordea and Macrobond
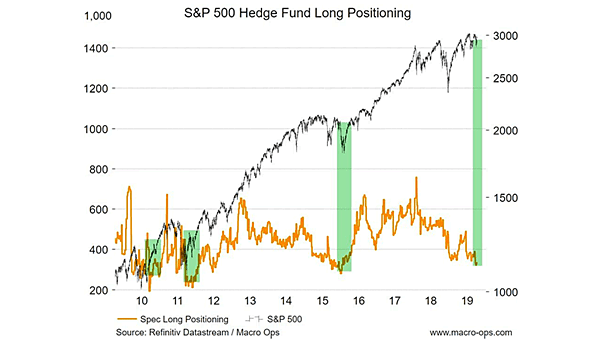
S&P 500 Hedge Fund Long Positioning Speculative long positions in the S&P 500 are near levels that have marked major bottoms in the past. Image: Macro Ops