NFIB Expected Credit Conditions
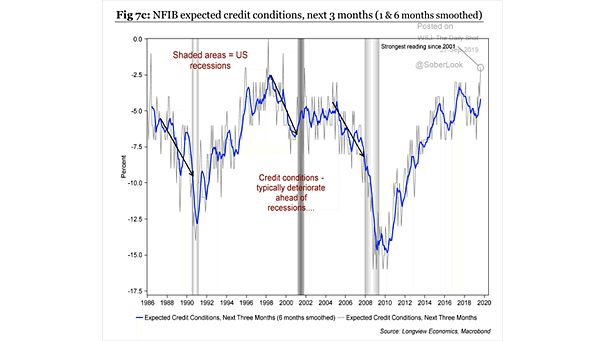
NFIB Expected Credit Conditions NFIB Expected Credit Conditions are improving and suggest that the U.S. expansion still has room to run. Source: Longview Economics
NFIB Expected Credit Conditions NFIB Expected Credit Conditions are improving and suggest that the U.S. expansion still has room to run. Source: Longview Economics
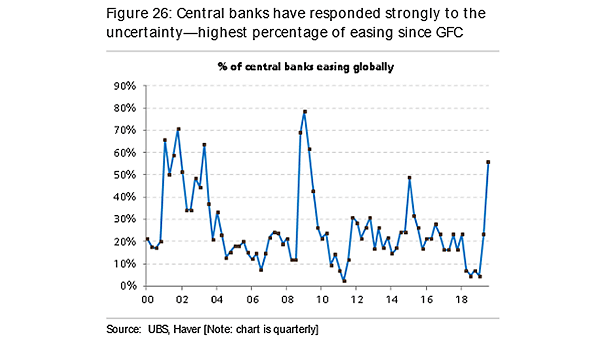
Percentage of Central Banks Easing Globally Currently, most of the world’s central banks are easing: 55% is the highest percentage since the global financial crisis. Image: UBS

Global Manufacturing: Manufacturing as Percentage of Gross Value Added The key question: is the United States really decoupled from the rest of the world? Image: Deutsche Bank Global Research
Ranking Developed Economies by Key Growth Metrics Currently, the United States is ranked numer one in real GDP, core CPI and consumer confidence. Image: Arbor Research & Trading
Distributions of Volatility by Countries This chart shows the average of 6-month rolling standard deviation of monthly returns over the last 10 years. Image: J.P. Morgan
U.S. Debt and Demographics This interesting chart clearly shows the large divergence between U.S. debt and demographics. Image: Fidelity Investments
S&P 500 Buyback Index vs. S&P 500 Total Return Index This chart clearly shows the large divergence between the S&P 500 Buyback Index and the S&P 500 Total Return Index. Image: Real Investment Advice
U.S. Economy and U.S. 10-Year Yield This chart suggests that the U.S. economy’s percentile relative to developed countries explains the U.S. 10-year yield. Image: Arbor Research & Trading LLC
Real M1 Leads Euro Area Real GDP Growth An imminent recession in the euro area? This interesting chart suggests that real M1 leads euro area real GDP growth by 12 months. Image: Pictet Wealth Management
S&P 500 Value vs. Growth Leads Global Industrial Production This great chart suggests that the S&P 500 value vs. growth leads global industrial production by 9 months. Image: Alpine Macro
OECD Composite Leading Indicators Interesting chart showing the percentage of countries with OECD composite leading indices below the Unites States. Image: Bianco Research