China Imports Lead World GDP
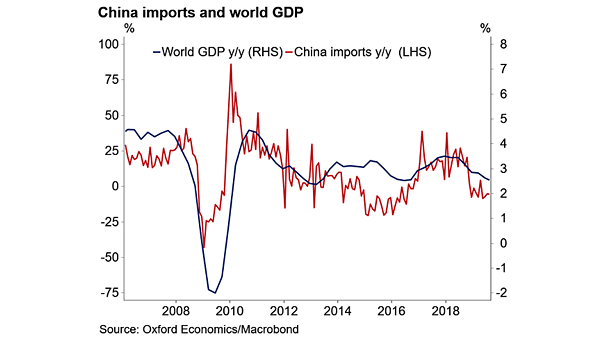
China Imports Lead World GDP This chart shows that China imports is a key factor of global growth, and clearly lead world GDP. Image: Oxford Economics, Macrobond
China Imports Lead World GDP This chart shows that China imports is a key factor of global growth, and clearly lead world GDP. Image: Oxford Economics, Macrobond
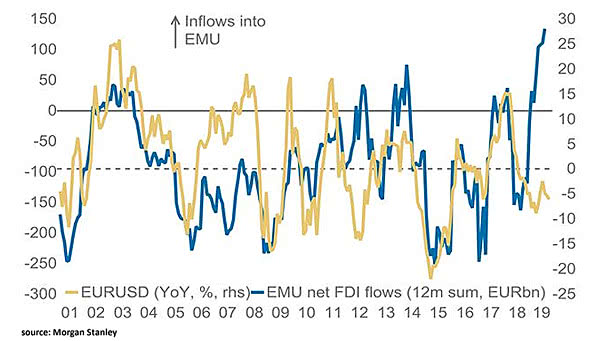
European Economic and Monetary Union (EMU) Inflows and EUR/USD European Economic and Monetary Union (EMU) inflows usually suggest a weaker U.S. dollar. Image: Morgan Stanley
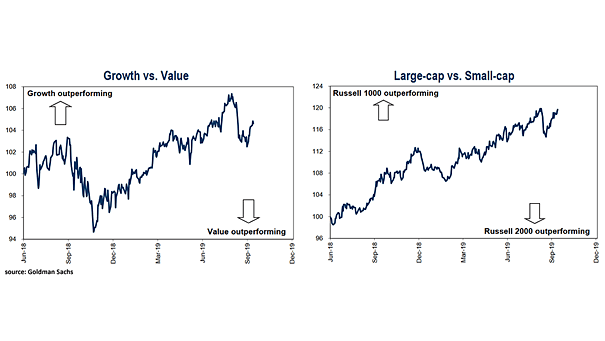
Growth Stocks vs. Value Stocks and Large-Cap vs. Small-Cap Around first rate cut, when growth stocks and large-cap stocks outperform, it does not suggest a recession is coming. Image: Goldman Sachs Global Investment Research
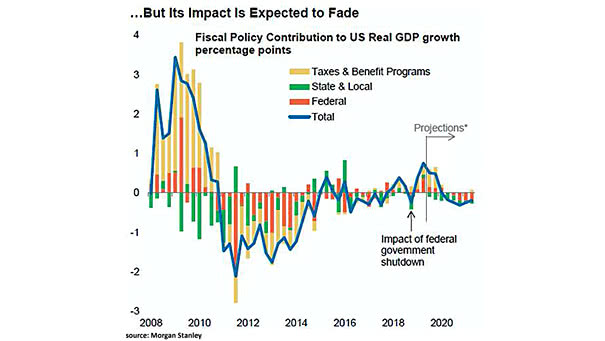
Fiscal Policy Contribution to U.S. Real GDP Growth The impact of fiscal policy contribution to U.S. real GDP growth is expected to fade in 2020. Image: Morgan Stanley
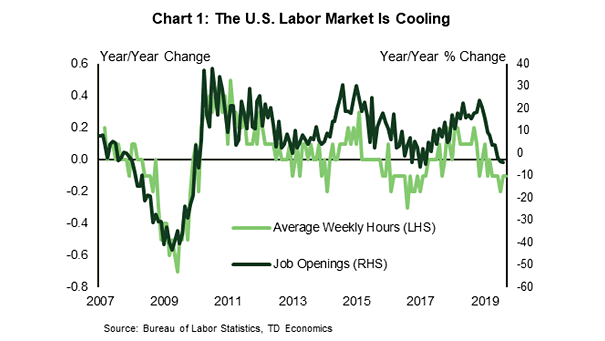
Job Openings and Average Weekly Hours The number of job openings fell in August, mirroring the decline in average weekly hours, and confirming that the U.S. labor market is cooling. Image: TD Bank Financial Group
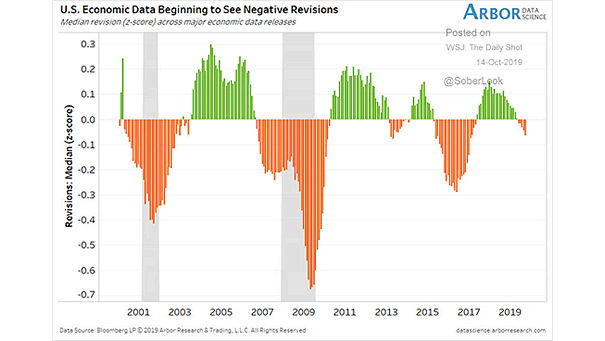
U.S. Economic Data Chart showing that U.S. economic data revisions have turned negative. Image: Arbor Research & Trading LLC
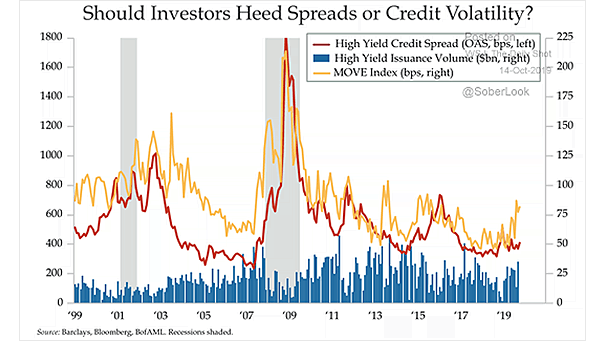
High Yield Credit Spread and Move Index Does higher rate credit volatility imply a widening of high-yield spreads? Image: Quill Intelligence, LLC
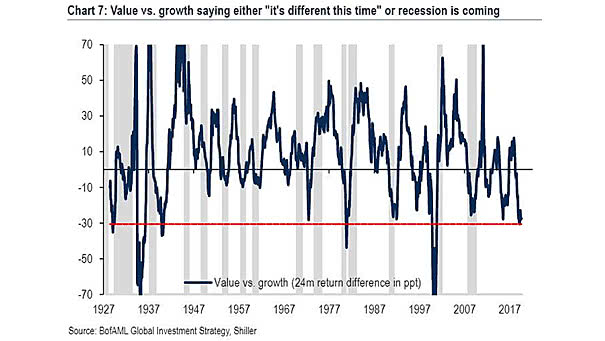
Value vs. Growth Stocks Since 1927, U.S. growth stocks have outperformed value stocks by 30% over a 2-year period, on five occasions. Each time, it was before a recession or a war. Is it different…
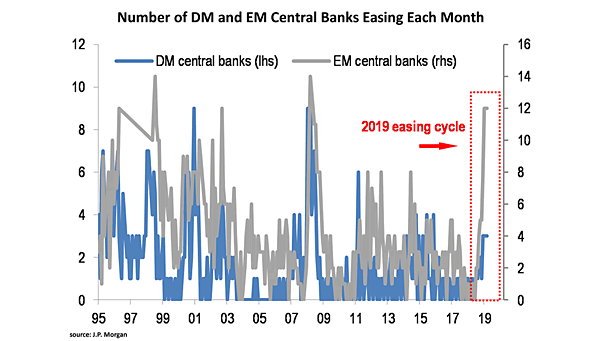
Number of DM and EM Central Banks Easing Each Month Currently, most of the world’s central banks are easing, to boost money supply in the economy and stimulate economic growth. Image: J.P. Morgan
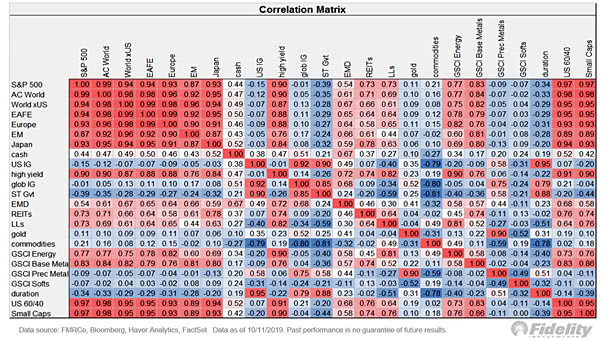
Correlation Matrix This grid shows the correlation between different asset classes. It is very useful for asset allocation. Image: Fidelity Investments
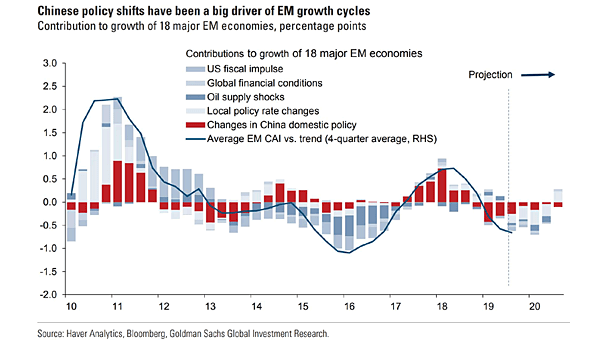
China Domestic Policy and Emerging Markets Growth Cycles Great chart suggesting that changes in China domestic policy have been a big driver of EM growth cycles. Image: Goldman Sachs Global Investment Research