World – Digital Competitiveness Rankings
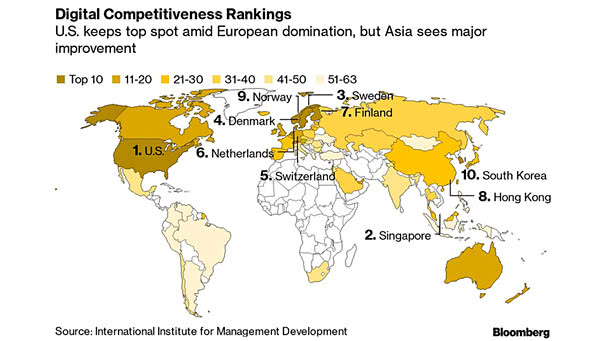
World – Digital Competitiveness Rankings The United States is ranked as the world’s most digitally competitive economy. Image: Bloomberg
World – Digital Competitiveness Rankings The United States is ranked as the world’s most digitally competitive economy. Image: Bloomberg
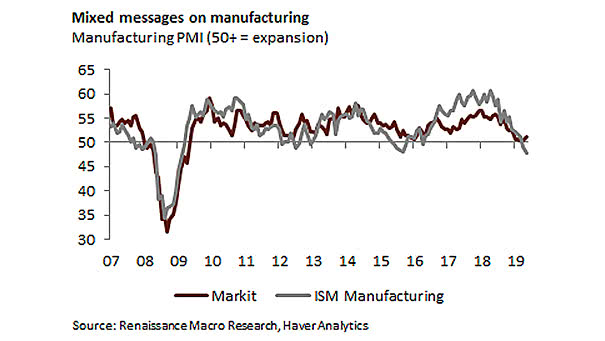
U.S. Markit Manufacturing PMI vs. U.S. ISM Manufacturing PMI The ISM Manufacturing PMI fell to 47.8 (contraction) in September, while the Markit Manufacturing PMI improved to 51.1 (expansion). Image: Renaissance Macro
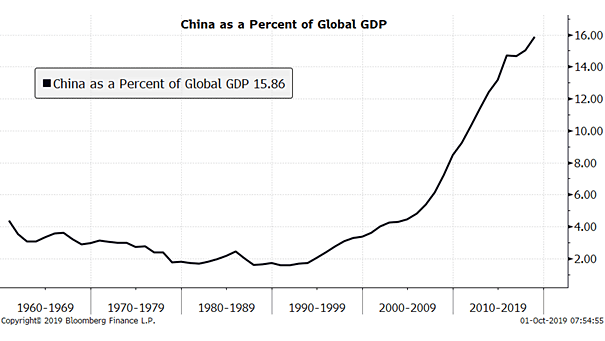
China as a Percent of Global GDP China is the world’s second largest economy, contributing 15.86% to global GDP in 2018. The United States remains the world’s largest economy, contributing 23.9% to global GDP. Image: Bloomberg,…
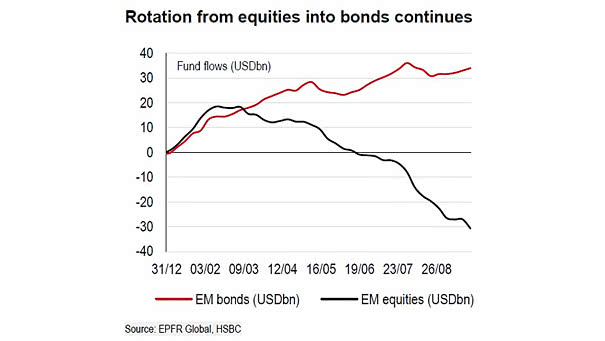
Fund Flows into Emerging Markets Stocks and Bonds The rotation into bonds and out of equities continues. Image: HSBC
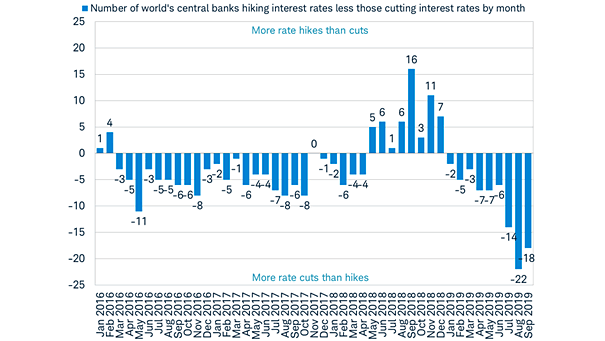
World’s Central Banks Are Cutting Rates World’s central banks are lowering interest rates, in order to boost money supply in the economy and stimulate economic growth. Image: Charles Schwab
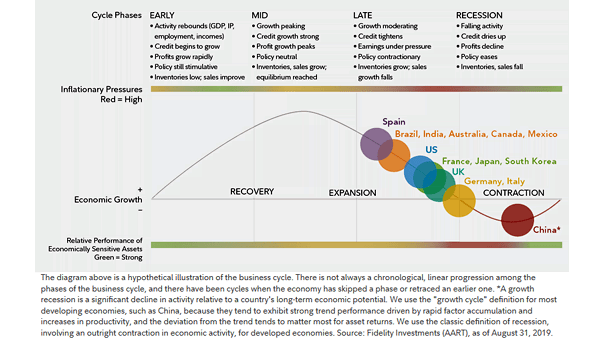
Stages of the Business Cycle as of August 31, 2019 This chart suggests that most major economies are in the late phase of the business cycle. Image: Fidelity Investments
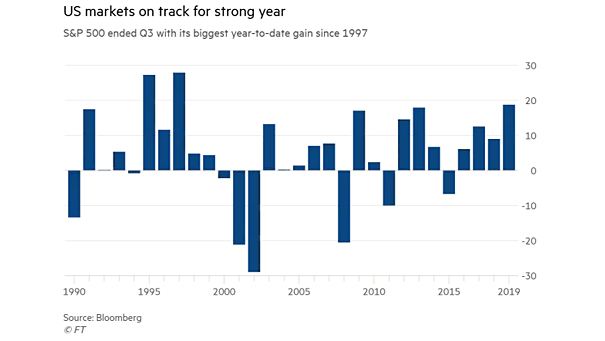
Annual S&P 500 Return Since 1990 Currently, the S&P 500 Index has its best year since 1997. Image: Financial Times
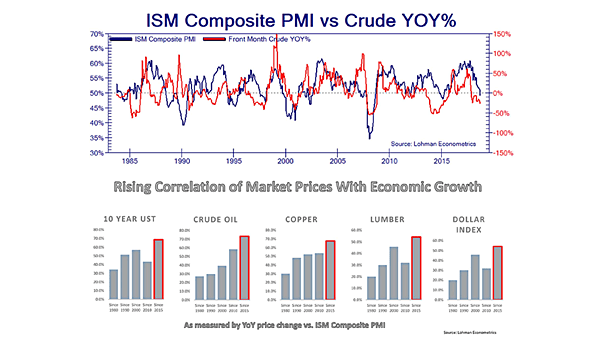
ISM Composite PMI vs. Crude Oil Interesting chart showing that the correlation between the ISM Composite PMI and crude oil is up to 75% since 2015. Image: Lohman Econometrics
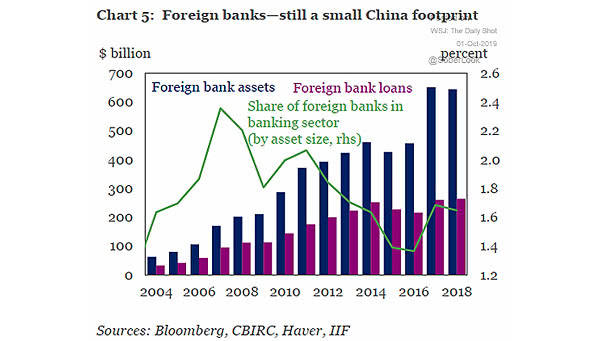
Foreign Bank Assets and Loans in China This interesting chart shows that foreign banks have a very small footprint in China. Image: Institute of International Finance
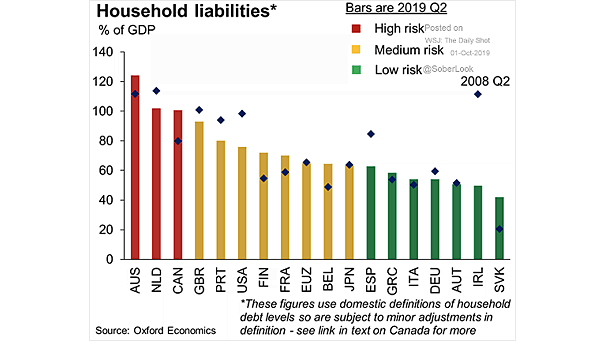
Household Debt to GDP by Country This chart shows a global view of household debt as a percent of GDP. Households of Australia, Netherlands and Canada are the most indebted in the world. Image: Oxford…
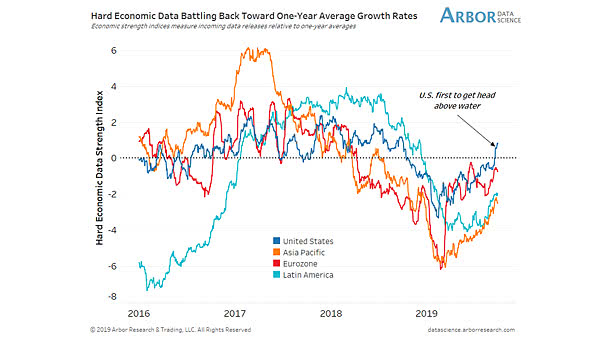
Hard Economic Data Hard economic data is improving in Eurozone, Asia Pacific, Latin America and the United States. Image: Arbor Research & Trading