Brent 5-Year Futures Price
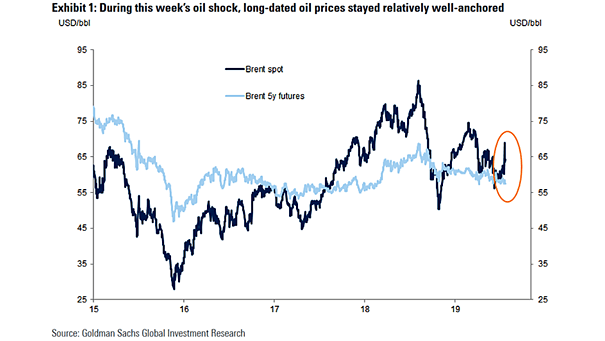
Brent 5-Year Futures Price This chart shows that long-dated oil prices stayed relatively flat after attacks on Saudi Arabia’s oil infrastructure. Image: Goldman Sachs Global Investment Research
Brent 5-Year Futures Price This chart shows that long-dated oil prices stayed relatively flat after attacks on Saudi Arabia’s oil infrastructure. Image: Goldman Sachs Global Investment Research
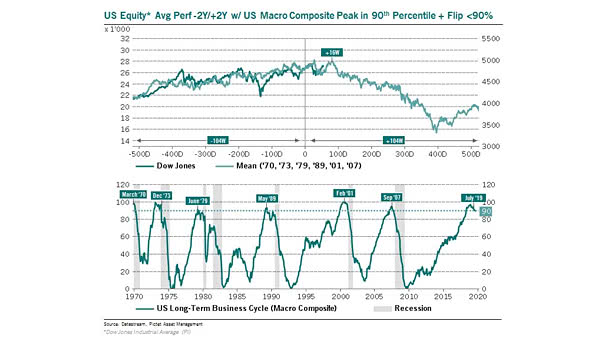
U.S. Long-Term Business Cycle and Recessions This chart suggests that historically, when the U.S. long-term business cycle peaks in the 90th percentile and turns lower, it doesn’t bode well for equities around 4 months later…
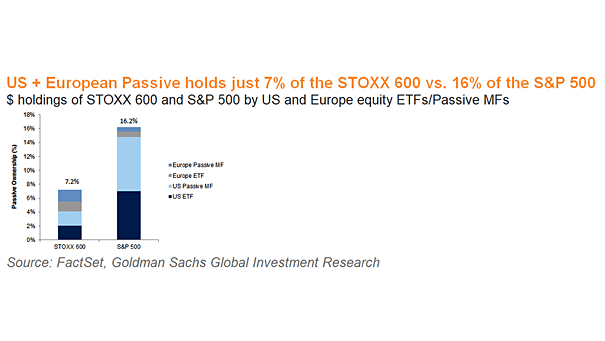
The Growth of Passive Investing in the U.S. and Europe Passive ownership represents 16.2% in the U.S. compared to 7.2% in Europe. Image: Goldman Sachs Global Investment Research
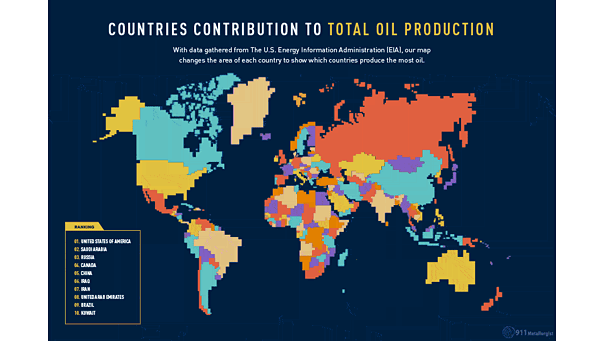
Countries Contribution to Total Oil Production The United States accounted for 18% of global oil production in 2018. Image: Visual Capitalist
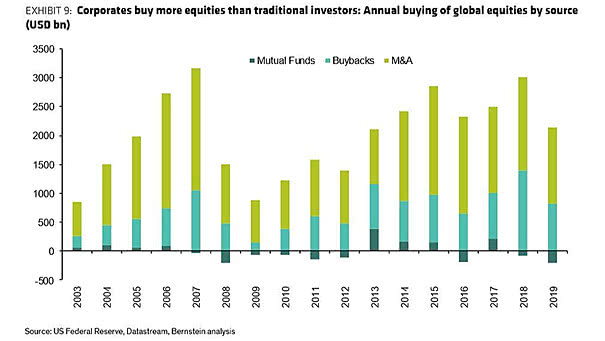
Annual Buying of Global Equities by Source The only buyer of equities remains corporates, not institutions and households. Image: Bernstein
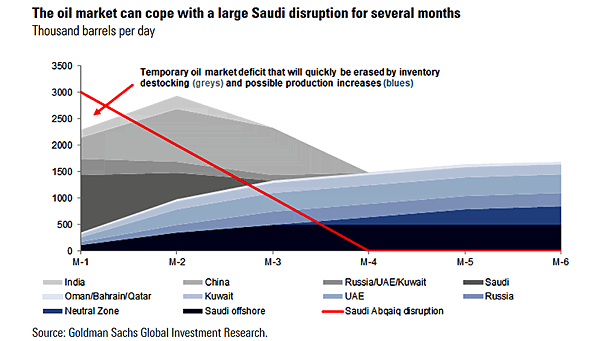
Oil Market Disruption This chart suggests that “the oil market can cope with a larger Saudi disruption for several months.” Image: Goldman Sachs Global Investment Research
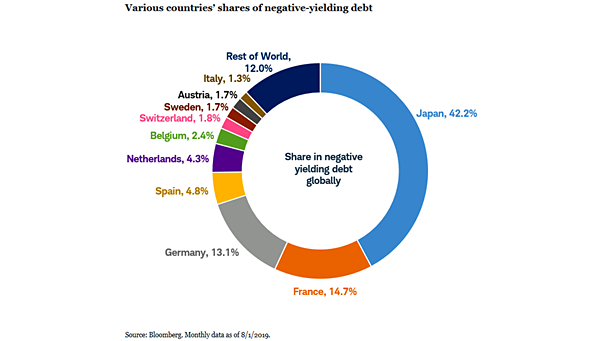
Various Countries’ Shares of Negative-Yielding Debt There are $13.44 trillion in negative-yielding bonds around the globe, as of 9/15/2019. Image: Charles Schwab
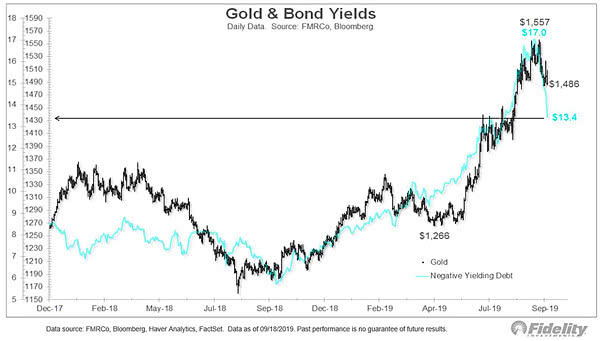
Gold and Negative Yielding Debt This chart shows the strong correlation between gold and market capitalization of global negative yielding debt. Negative global yields are a support for gold.
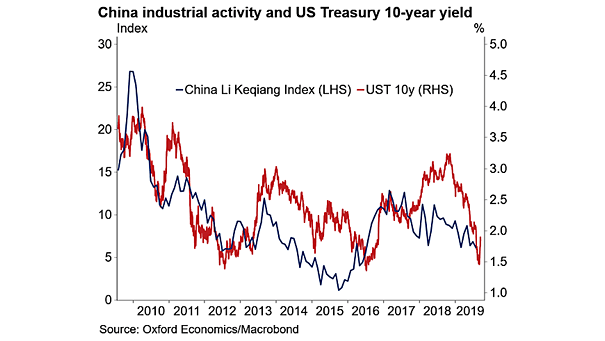
China Industrial Activity and U.S. Treasury 10-Year Yield This chart shows the quite good correlation between China industrial activity and the U.S. treasury 10-year yield. Image: Oxford Economics, Macrobond
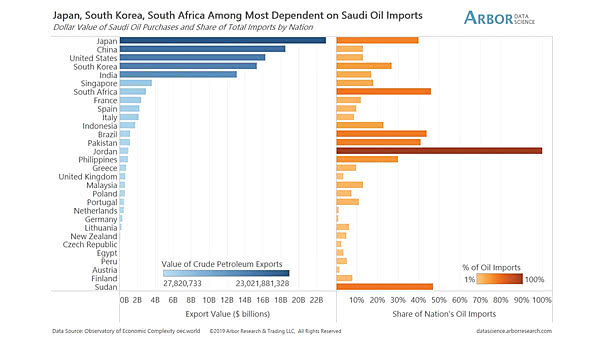
Countries Dependent on Saudi Oil Imports Japan, South Korea and South Africa are among the countries most dependent on Saudi oil imports. Image: Arbor Research & Trading LLC
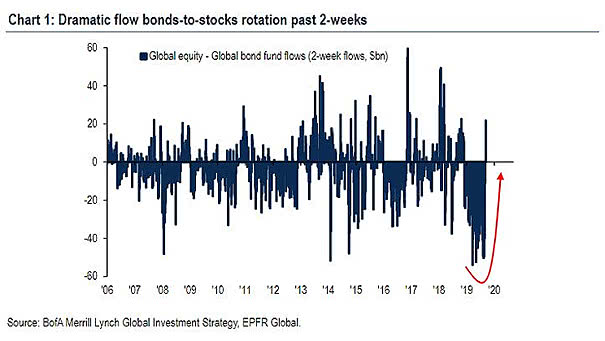
Global Equity – Global Bond Fund Flows In the past two weeks, investors have shifted from bonds to equities. Image: BofA Merrill Lynch Global Investment Strategy