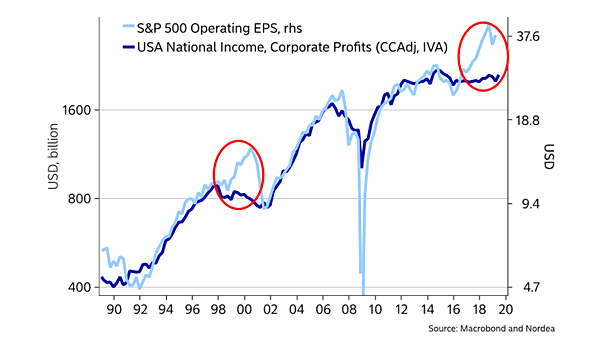
S&P 500 Performance by President, from Reagan to Trump

S&P 500 Performance by President, from Reagan to Trump For President Trump, the stock market is a scorecard. This chart shows the S&P 500 performance across different presidencies, from Reagan to Trump. Image: Deutsche Bank

How Many Recessions People Lived Through As An Adult?

How Many Recessions People Lived Through As An Adult? This chart puts recessions into perspective. Currently, about 40 million American adults haven’t experienced a single recession during their working lives. Image: The Washington Post

U.S. Household Debt and World Trade

U.S. Household Debt and World Trade This chart shows the pretty good correlation between U.S. household debt and world trade. Image: Oxford Economics, Macrobond

U.S. Recession Probability and the U.S. Dollar

U.S. Recession Probability and the U.S. Dollar The chart shows the correlation between the NY Fed probability of U.S. recession and the U.S. dollar. Image: BofA Merrill Lynch

Ken Fisher on the Yield Curve​

Ken Fisher on the Yield Curve In this short video, Ken Fisher explains what the yield curve is and its impact on the market. You may also like other videos by Ken Fisher. https://www.youtube.com/watch?v=ld3D5B8_wAU&list=PL1F15F9796653B69B&index=23&t=0s