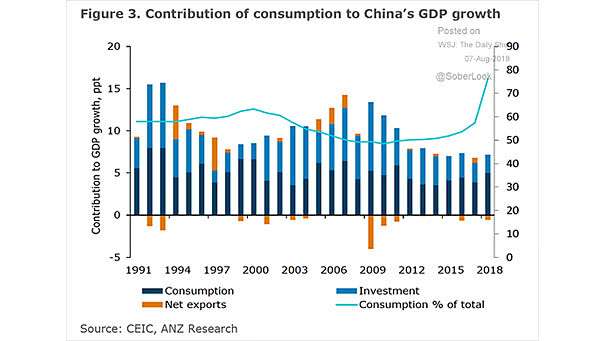
Contribution of Consumption to China’s GDP Growth
Contribution of Consumption to China’s GDP Growth This chart shows that consumption is the primary driver of China’s economic growth. You may also like “China Real GDP Growth Projection.” Image: ANZ Research