S&P 500 5% Pullbacks per Year
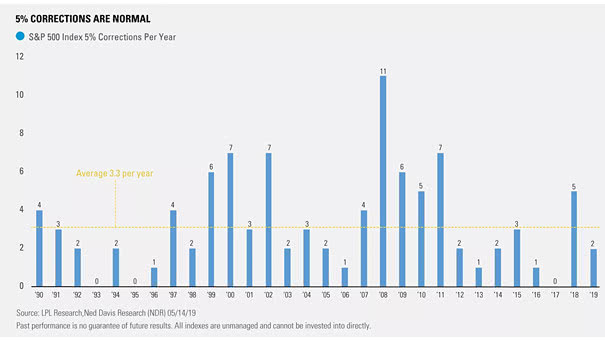
S&P 500 5% Pullbacks per Year Since 1990, the average number of 5% pullbacks in the S&P 500 Index per year is 3.3. Currently, 2019 has two pullbacks of 5%. Image: LPL Research
S&P 500 5% Pullbacks per Year Since 1990, the average number of 5% pullbacks in the S&P 500 Index per year is 3.3. Currently, 2019 has two pullbacks of 5%. Image: LPL Research
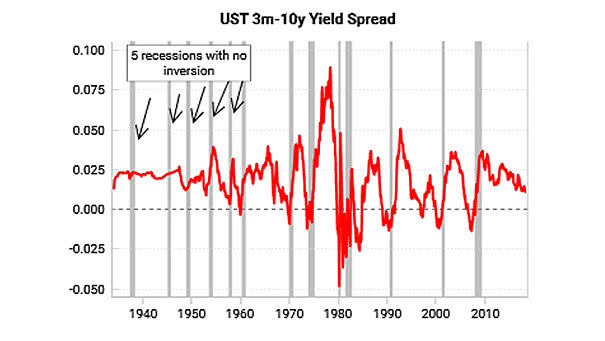
U.S. Recession With No Yield Curve Inversion Before 1960, five recessions occurred with no yield curve inversion. The yield curve is one recession indicator among many others. Image: Variant Perception Research

ISM Manufacturing Index and U.S. 10-Year Treasury Bond Yield The decline in U.S. 10-year Treasury bond yields has been in line with falling ISM PMI. Picture Source: Deutsche Bank
Time in Recession Since 1950, the United States has spent 10% of the time in recession compared to 33% for Argentina. Image: Bloomberg
S&P 500 Forward EPS and World Trade Growth The chart shows a pretty good correlation between the S&P 500 forward 12-month EPS and the CPB World Trade Index. Image: Oxford Economics, Macrobond
Performance of S&P 500 Around the First Late-Cycle Rate Cut After the first-rate late-cycle cut, the S&P 500’s performance is generally not exceptional. Image: Societe Generale Cross Asset Research
Active Equity Managers Still Underperform This chart shows the low percentage of active funds that outperformed and how difficult it really is to beat the market over time. You may also like “The Rise of…
Term Premium on a 10-Year Zero Coupon Bond Term premium on a 10-year zero coupon bond remains in negative territory. Investors do not seem to fear rising rates over the long-term. The term premium is the…
U.S. Unemployment Rate: Black or African Americans The U.S. unemployment rate of Black or African Americans stands at 6.3%, while the civilian unemployment rate stands at 3.7%, near its lowest level in almost 50 years. You…
Longest Losing Streak for Global PMI Global PMI falls for 15 months in a row. New tariffs will certainly not help. Image: Charles Schwab
Long-Term Trends in the Price of Commodities This chart shows that a large pattern appears in the price of movements of commodities. Image: Visual Capitalist