U.S. Economic Expansions
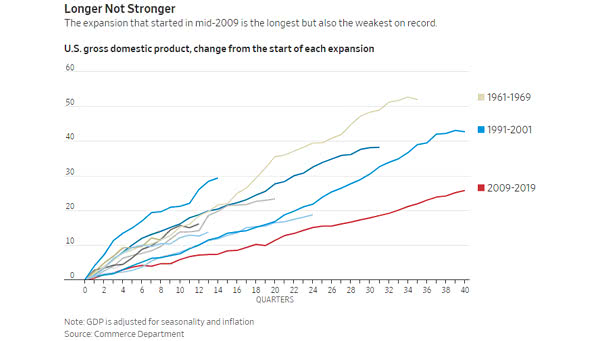
U.S. Economic Expansions The current business cycle is the longest expansion, but it’s also the weakest. Image: The Wall Street Journal
U.S. Economic Expansions The current business cycle is the longest expansion, but it’s also the weakest. Image: The Wall Street Journal
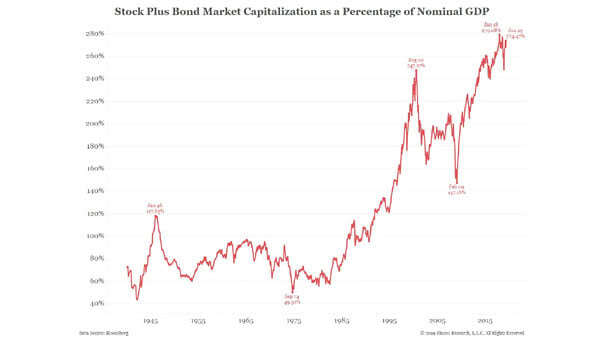
Stock Plus Bond Market Capitalization as a Percentage of Nominal GDP The current reading is pretty high at 274.47%. You may also like the “Stock Market Valuation” and “S&P 500 Index – Earnings & Valuation.” Image: Bianco…
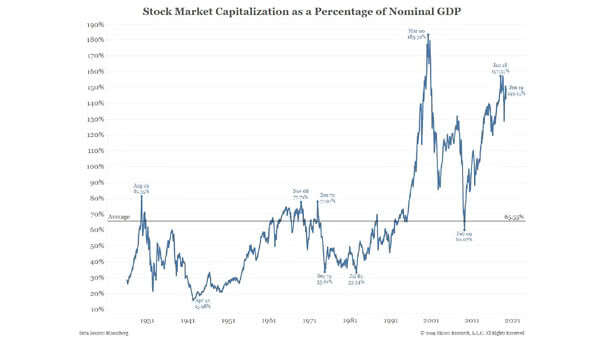
Stock Market Capitalization as a Percentage of Nominal GDP This ratio is useful in determining whether the U.S. stock market is undervalued or overvalued relative to its historical average. The current reading is pretty high…
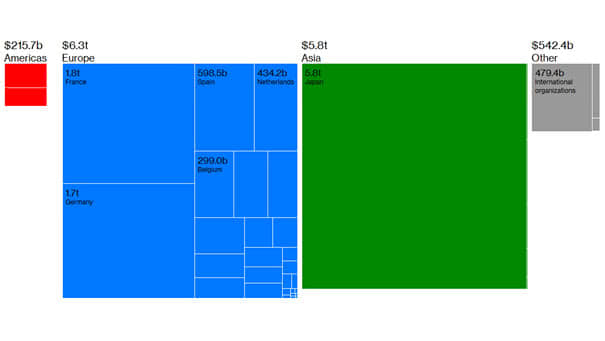
Negative-Yielding Debt by Country The chart shows negative-yielding debt by country as of June 2019. Bondholders will get back less than what they paid if they hold bonds to maturity. So, in a sense, negative…
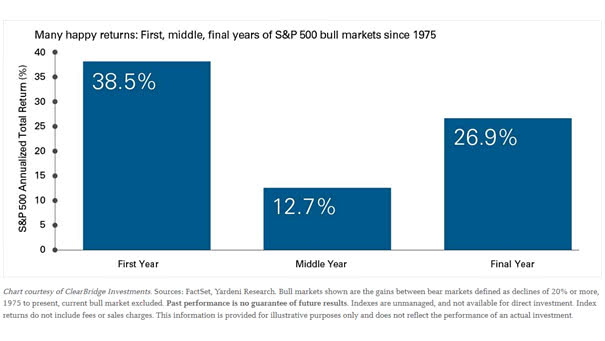
First, Middle, Final Years of S&P 500 Bull Markets since 1975 The chart shows that the S&P 500 has generated a 26.9% return on average, in the final years of bull markets since 1975, excluding…
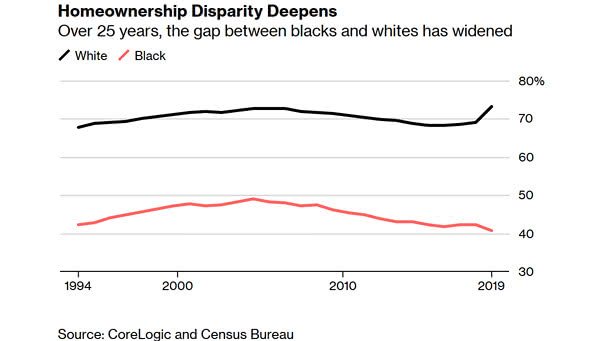
Homeownership Disparity Deepens Since 1994, the gap between blacks and whites has widened, in part because starter-home prices have exploded, year after year. Inequality: you may also like “U.S. Unemployment Rate: Black or African Americans”…
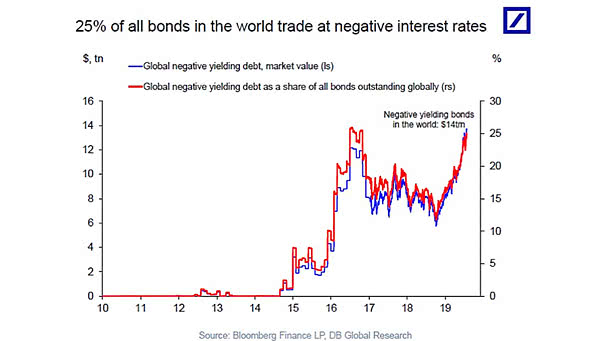
Negative Yielding Bonds In the World Now, 25% of all bonds in the world trade at negative interest rates. Keep in mind that raising interest rates in the future could be painful for bond investors.…
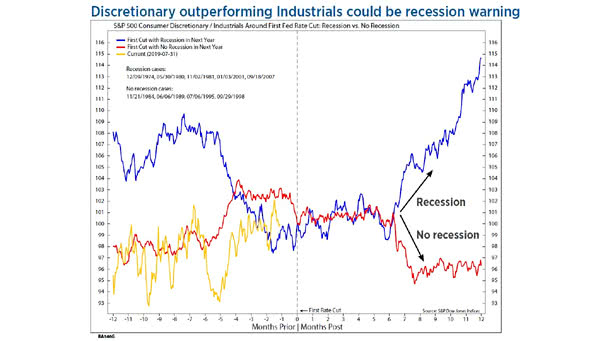
S&P 500 Consumer Discretionary / Industrials Around First Fed Rate Cut If consumer discretionary outperforms industrials after first Fed rate cut, then it could signal a recession. Image: Ned Davis Research
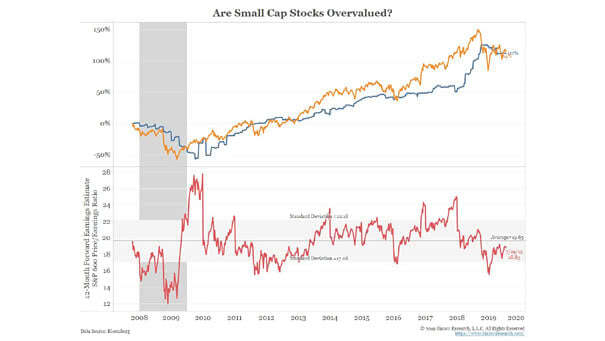
Are Small Cap Stocks Overvalued? Small Cap Stocks Valuation: based on the forward PE ratio, the valuation of small cap stocks seems reasonable, with no sign of bubble. You may also like our “Stock Market…
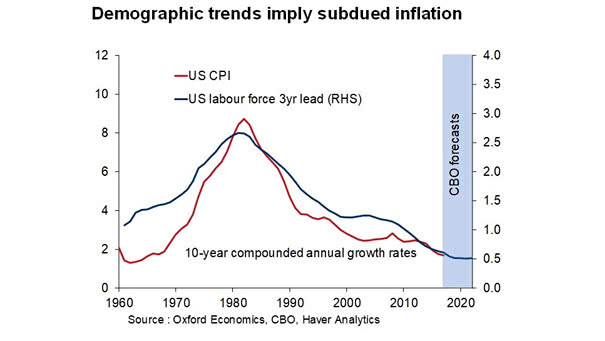
U.S. Labor Force vs. Inflation The chart shows the enduring link between labor force and inflation. The chart also suggests that U.S. labor force leads U.S. CPI by three years. Demographic trends imply subdued inflation.…
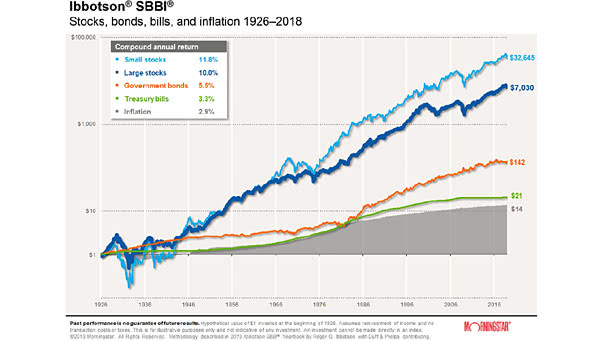
Stocks, Bonds, Bills, and Inflation since 1926 Great chart showing the hypothetical value of $1 invested in stocks, bonds, and bills, at the beginning of 1926. Warren Buffett is right when he says that stocks…