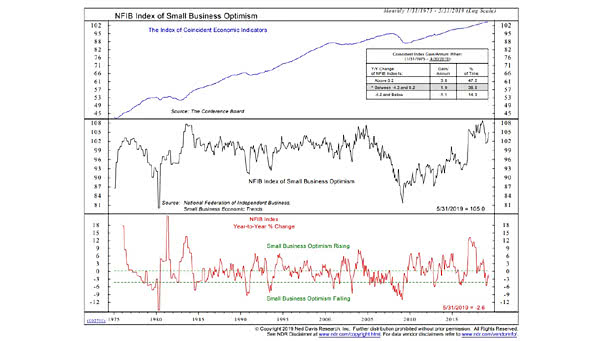
NFIB Small Business Optimism Index
NFIB Small Business Optimism Index The Small Business Optimism Index is driving economic growth. It is a good indicator of the health of small businesses in the U.S.. Image: Ned Davis Research
NFIB Small Business Optimism Index The Small Business Optimism Index is driving economic growth. It is a good indicator of the health of small businesses in the U.S.. Image: Ned Davis Research
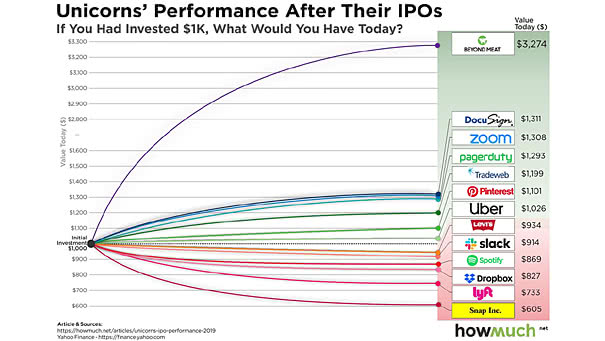
Unicorn’s Performance After Their IPOs A unicorn is a privately held startup company with a value of over $1 billion. The chart below shows the value today, if you had invested $1000 at the time…
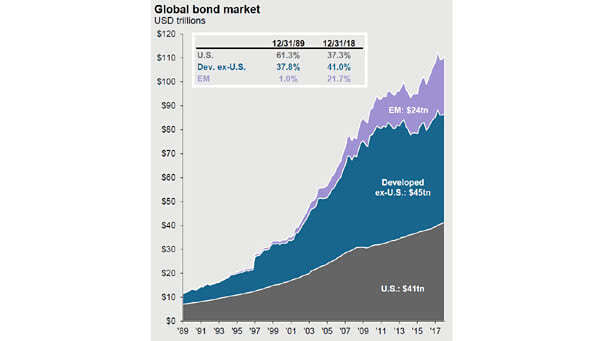
Global Bond Market This chart shows the growing global “bond bubble.” Since 2000, the global bond market has tripled in size. Image: J.P. Morgan Asset Management
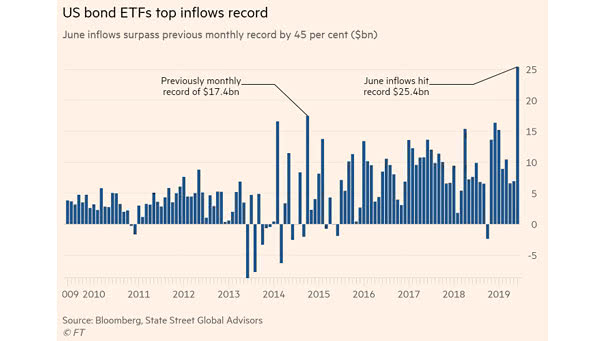
U.S. Bond ETFs Top Inflows Record In June, investors significantly increased their exposure to bond funds, as weak economic data fuels slowdown worries. U.S. bond ETFs inflows hit $25.4bn. Image: Financial Times
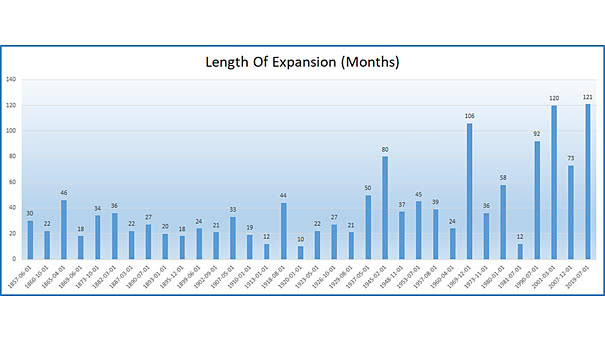
Longest Economic Expansion in U.S. History Since the Great Recession, the U.S. economy has grown for 121 consecutive months. This is the longest economic expansion in American history. You may also like “Strength of Economic…
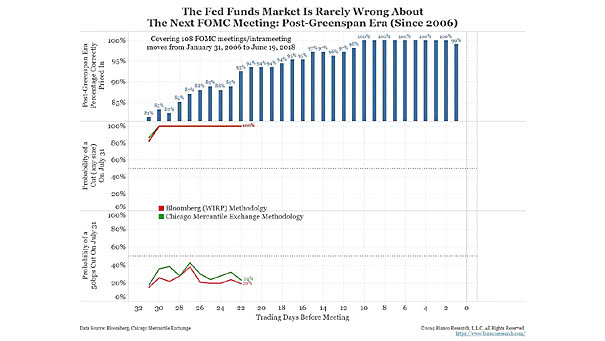
Before the Next FOMC Meeting, the Fed Funds Market Is Pretty Accurate Probability of a Fed rate cut on July 31, 2019: 100% (Fed funds market expectation). Image: Bianco Research
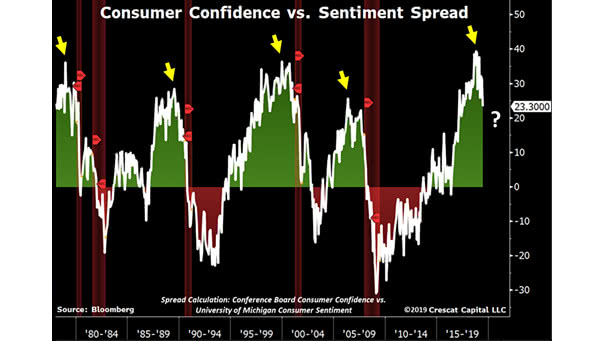
Conference Board Consumer Confidence Index vs. University of Michigan Consumer Sentiment Index History tells us that before a recession, the consumer confidence vs. sentiment spread always peaks and then declines. Image: Crescat Capital LLC
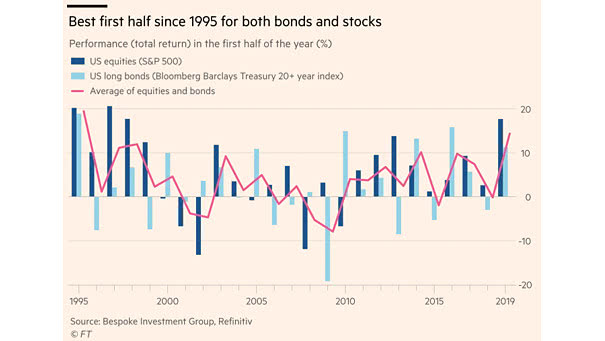
Best First Half for U.S. Equities and U.S. Bonds since 1995 Since 1995, it is the best first half for U.S. equities and U.S. long bonds, despite the challenge of low bond yields. Image: Financial…
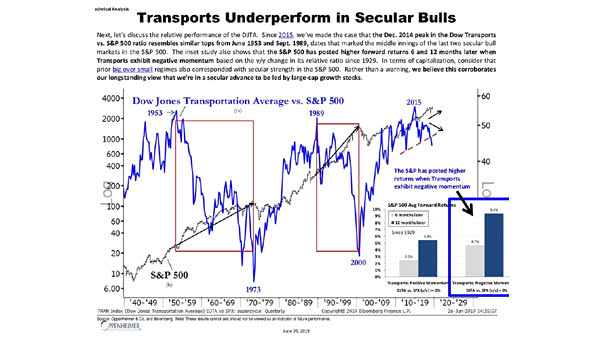
Dow Jones Transportation Average vs. S&P 500 This interesting chart suggests that the Dow Jones Transportation Average underperforms in secular bull markets. Actually, the S&P 500 had higher returns when the Dow Jones Transportation Average…
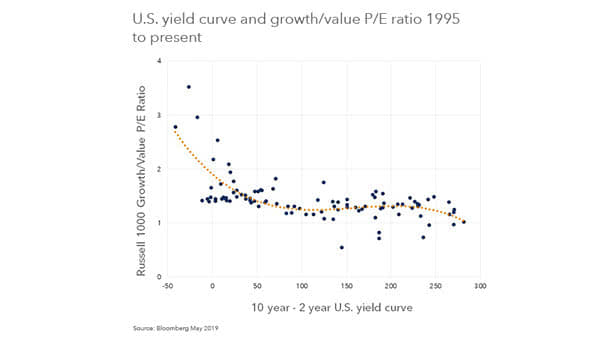
U.S. Yield Curve and Growth/Value P/E Ratio The chart below shows that the shape of yield curve explains nearly 50% of the variation in value vs. growth multiples. Actually, when the U.S. economy is sluggish,…
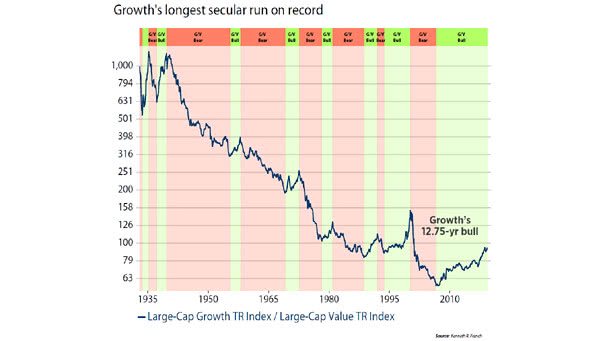
Will Value Ever Outperform Growth? When the U.S. economy is weak, investors prefer growth stocks. But value could outperform again, when the U.S. economy will be stronger. Image: Ned Davis Research