Concern about the Trade War
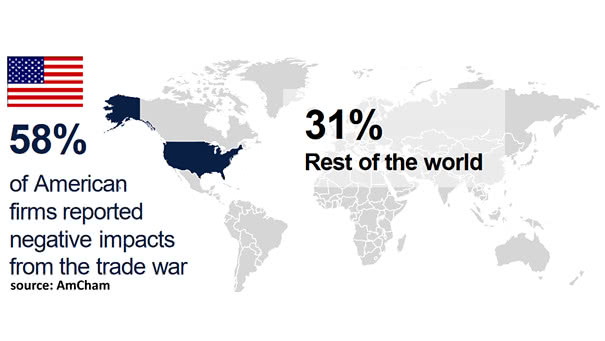
Concern about the Trade War 58% of American firms reported negative impacts from the trade war, versus 31% of non-American firms. Ouch! Image: American Chamber of Commerce in Singapore
Concern about the Trade War 58% of American firms reported negative impacts from the trade war, versus 31% of non-American firms. Ouch! Image: American Chamber of Commerce in Singapore
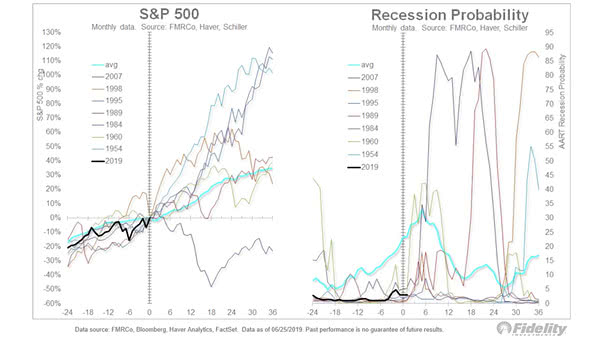
S&P 500 and Recession Probability Great chart showing twelve Fed easing cycles since the 1950s, including the recession probability and the average return of the S&P 500 Index. Image: Fidelity Investments
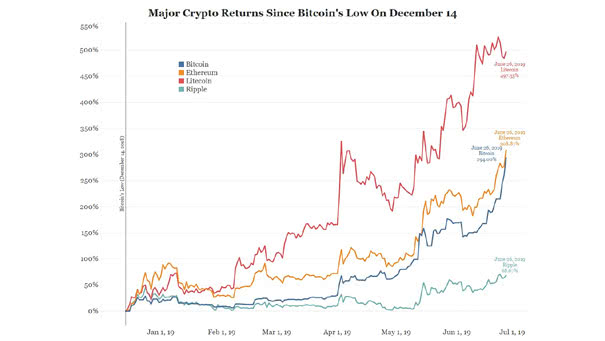
Major Crypto Returns Since Bitcoin’s Low Since December 14, 2018 low, other major cryptocurrencies have outperformed Bitcoin. Image: Bianco Research
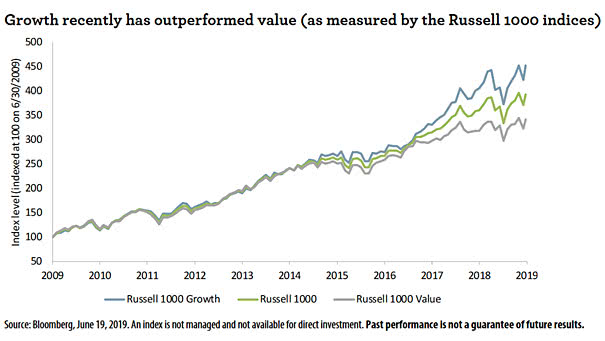
Growth Has Outperformed Value Since 2015 Is is time for value stocks to shine? Actually, tech stocks contribute to widening the gap between growth and value. Image: Wells Fargo Investment Institute
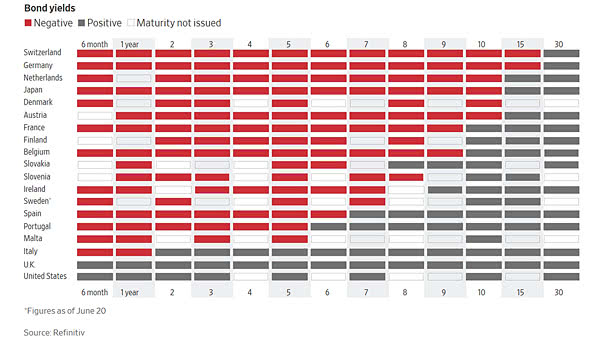
The World Has $13 Trillion of Debt With Negative Yields But there are still positive-yield bonds. Image: The Wall Street Journal
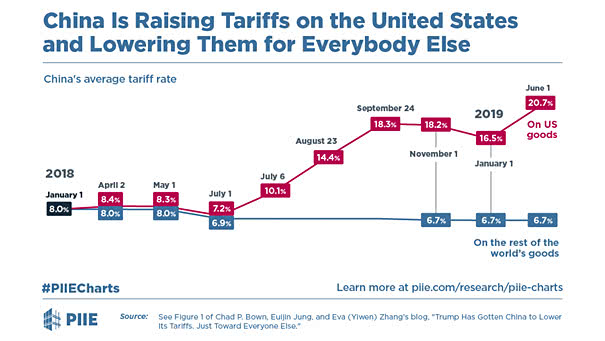
China is Raising Tariffs Only on the U.S. Actually, China is lowering tariffs on other countries. Image: Peterson Institute for International Economics
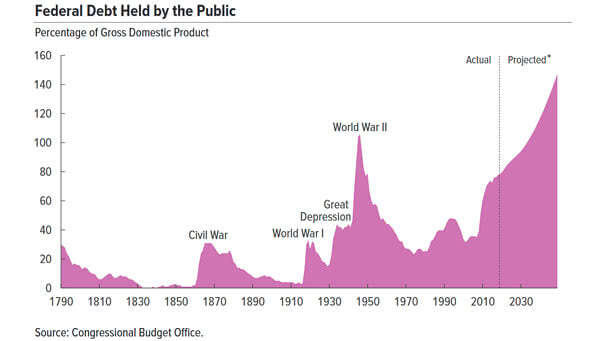
U.S. Federal Debt Held by the Public Rising U.S. federal debt could increase the likelihood of a fiscal crisis in the future. Image: Congressional Budget Office
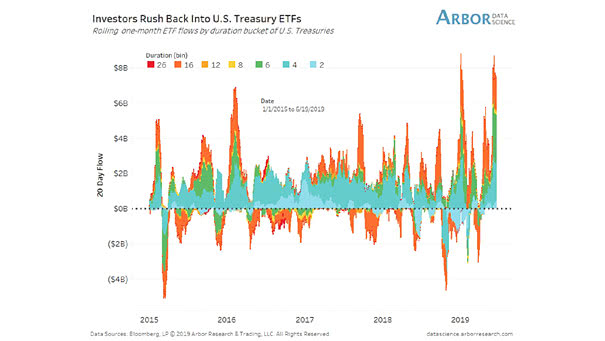
Investors Preference for U.S. Bond Funds Investors rush back into U.S. Treasury ETFs as trade and growth fears rise. Image: Arbor Research & Trading LLC
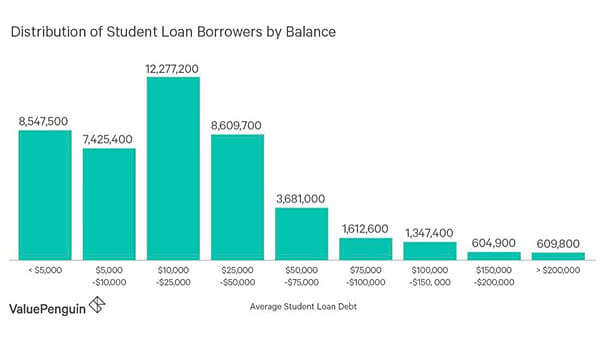
Distribution of Student Loan Borrowers by Balance Interesting chart showing that most student loan debts range between $10,000 and $25,000. You may also like “America’s Student Debt by State.” Image: ValuePenguin
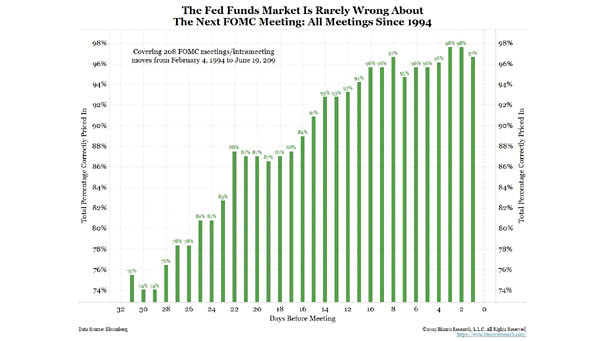
The Fed Funds Market Is Rarely Wrong About the Next FOMC Meeting Seven days before a FOMC meeting, the market has been accurate 95% of the time since 1994. Image: Bianco Research
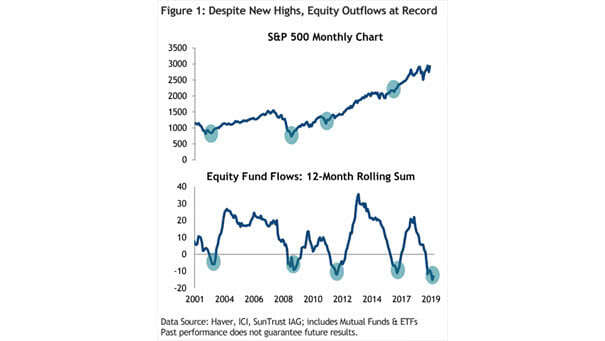
Equity Fund Outflows at Record History tell us that equities rose significantly. Image: SunTrust IAG