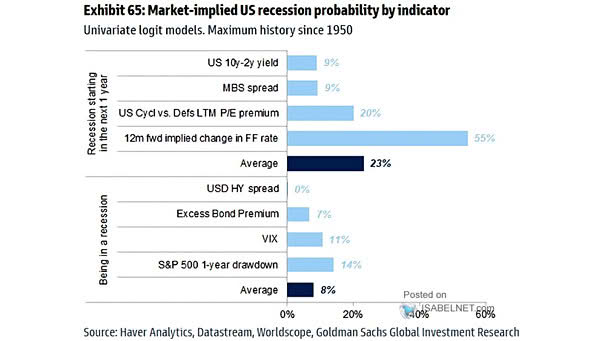
Probability of U.S. Recession

Probability of U.S. Recession The one-year U.S. recession probability implied by the S&P 500 and BBB spread has eased, pointing to a more constructive market tone as fears of near-term economic stress fade. Image: J.P.…

S&P 500 Performance After >10% April/May Returns

S&P 500 Performance After >10% April/May Returns The S&P 500 surged 16.1% in April and May, the second-best performance on record. History suggests momentum tends to carry. In prior double-digit gains, June has always been…

Valuations – 12-Month Forward P/E Ranges (MSCI Regions)

Valuations – 12-Month Forward P/E Ranges (MSCI Regions) Valuations in U.S. and global equities remain stretched, with earnings momentum doing most of the work. As long as companies keep posting solid results, investors seem willing…

ISM Manufacturing Index vs. S&P 500 Index

ISM Manufacturing Index vs. S&P 500 Index U.S. manufacturing continued to gain traction in May, with the ISM Manufacturing Index rising to 54, above expectations of 53.1, and marking a fifth straight month of expansion.…

S&P 500 and Market Breadth Streaks

S&P 500 and Market Breadth Streaks The S&P 500 may be printing new highs, but the rally lacks broad participation. Weak breadth like this tends to point to underlying weakness and leaves the market more…

S&P 500 Return During June

S&P 500 Return During June June has a reputation for weakness in midterm years, but the last decade tells a different story: it closed higher in 9 out of 10 years, posting a median gain…

S&P 500 Around Major Geopolitical Events Since 1939

S&P 500 Around Major Geopolitical Events Since 1939 The S&P 500’s reaction to the Middle East conflict has shifted from one of the weakest after a geopolitical shock to one of the strongest, as investors…

S&P 500 vs. U.S. Treasuries

S&P 500 vs. U.S. Treasuries The S&P 500 looks stretched against Treasuries, trading over one standard deviation rich on a year-on-year basis and in the 95th percentile of the past 50 years. A return to…

Smoothed U.S. Recession Probabilities

Smoothed U.S. Recession Probabilities The probability of U.S. recession stands at 0.44%. When this recession indicator exceeds 5% (red line), history suggests that the probability of recession increases significantly. The chart shows the smoothed U.S.…

S&P 500 Trend Channel

S&P 500 Trend Channel The S&P 500 caught up to the bottom of the trend channel in place since October 2022. If buyers defend this level, the index could keep grinding higher along that support.…