New S&P 500 Index All-Time Highs Per Year

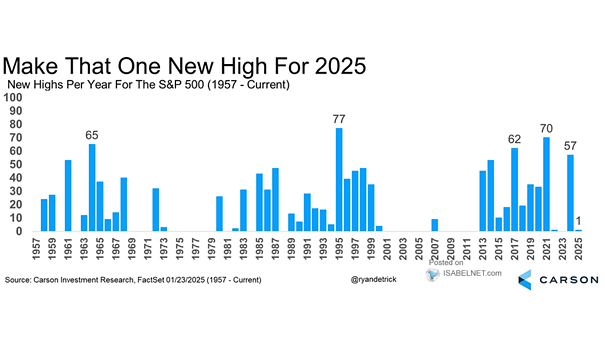
New S&P 500 Index All-Time Highs Per Year Bulls are smiling as the S&P 500 reached a new record high, driven by robust corporate earnings and optimism about economic growth. Such record-breaking periods typically occur in clusters and often lead to further gains. Image: Carson Investment Research

S&P 500 Earnings and Gross Buybacks

S&P 500 Earnings and Gross Buybacks With U.S. corporate earnings on the rise, share buybacks in 2025 are expected to exceed $1 trillion. Image: Deutsche Bank Asset Allocation

Global Market Capitalization of All Equities

Global Market Capitalization of All Equities With the United States dominating 67% of the global equity market, it seems the rest of the world is just there to enjoy the spectacle—complete with popcorn! Image: Goldman Sachs Global Investment Research

ISABELNET Cartoon of the Day

ISABELNET Cartoon of the Day Wall Street’s optimism is so high that even gravity seems bullish. As a result, bears are experiencing altitude sickness from the market’s rapid rise! Have a Great Day, Everyone! 😎

Average Probability S&P 500 Volatility Regime

Average Probability S&P 500 Volatility Regime The probability of a high S&P 500 volatility regime has increased, suggesting that elevated volatility could persist throughout 2025. Image: Goldman Sachs Global Investment Research

Global Economy – GDP Growth Projections

Global Economy – GDP Growth Projections The International Monetary Fund projects global economic growth of 3.3% for both 2025 and 2026, suggesting economic resilience despite ongoing challenges. Image: International Monetary Fund

Valuation – Price-to-Forward Earnings Ratios

Valuation – Price-to-Forward Earnings Ratios The U.S. stock market maintains a premium valuation compared to global markets, with the exception of India, leaving little room for error as it’s priced for perfection. Image: Goldman Sachs Global Investment Research

S&P 500 Index

S&P 500 Index Since its October 2022 low, the S&P 500 has seen substantial gains, largely driven by big tech companies. However, concerns are emerging about potential underperformance of these tech giants in 2025. Image: Bloomberg

S&P 500 Pre and Post Fed Rate Cuts

S&P 500 Pre and Post Fed Rate Cuts Historically, U.S. stocks have shown strong performance in the two years following the start of a Fed rate cut cycle, especially during nonrecessionary periods. Image: Goldman Sachs Global Investment Research

Truck Tonnage vs. S&P 500 Index

Truck Tonnage vs. S&P 500 Index The Truck Tonnage Index decreased 1.1% in December. Trucks represent 72.6% of U.S. freight and serve as a barometer of the U.S. economy. This chart shows that the U.S. stock market tends to increase in line with the physical size and expansion of the U.S. economy (R² = 0.77…