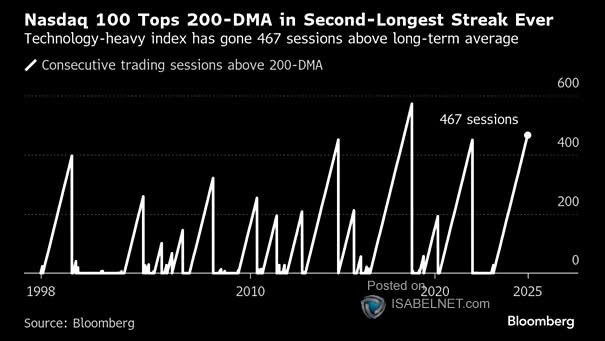
Nasdaq 100 – Consecutive Trading Sessions Above 200-Day Moving Average
Nasdaq 100 – Consecutive Trading Sessions Above 200-Day Moving Average The Nasdaq 100 has been trading above its 200-day moving average for 467 consecutive sessions, indicating a strong bullish trend that reflects sustained investor confidence and momentum in technology stocks. Image: Bloomberg